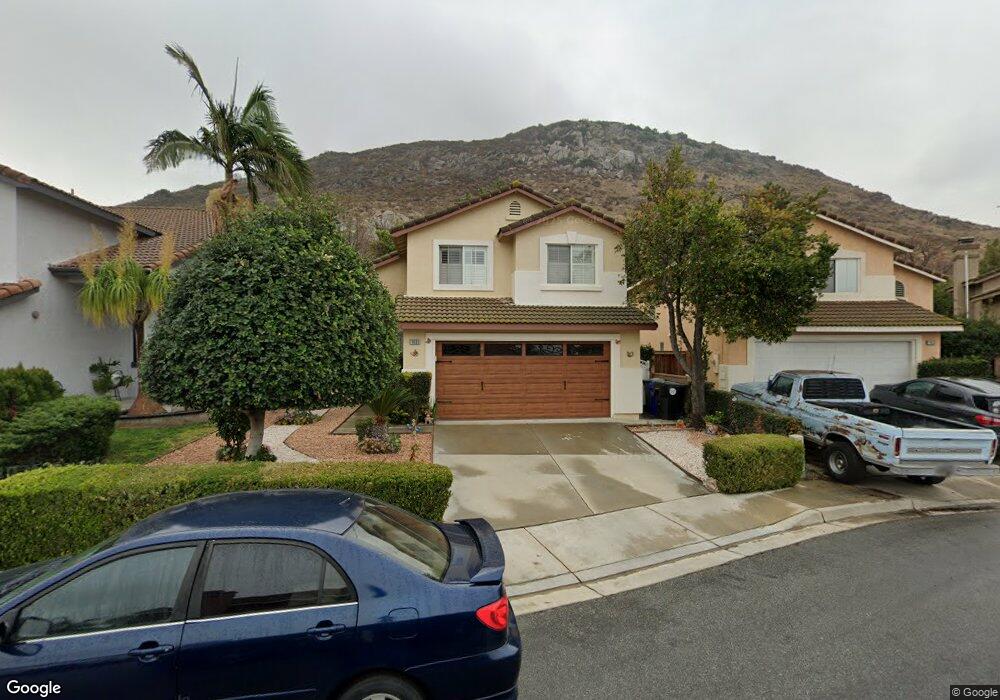
11633 Sparrow Dr Fontana, CA 92337
Southridge Village NeighborhoodEstimated Value: $611,031 - $662,000
4
Beds
3
Baths
1,751
Sq Ft
$365/Sq Ft
Est. Value
About This Home
This home is located at 11633 Sparrow Dr, Fontana, CA 92337 and is currently estimated at $638,258, approximately $364 per square foot. 11633 Sparrow Dr is a home located in San Bernardino County with nearby schools including Jurupa Vista Elementary School, Ruth O. Harris Middle School, and Bloomington High School.
Ownership History
Date
Name
Owned For
Owner Type
Purchase Details
Closed on
Nov 21, 2024
Sold by
Talamantes Francisca
Bought by
Francisca Talamantes Revocable Living Trust and Talamantes
Current Estimated Value
Purchase Details
Closed on
Jun 7, 2002
Sold by
Smith Paul
Bought by
Talamantes Francisca
Home Financials for this Owner
Home Financials are based on the most recent Mortgage that was taken out on this home.
Original Mortgage
$161,600
Interest Rate
5.87%
Purchase Details
Closed on
Jun 25, 1998
Sold by
Lewis Homes Enterprises
Bought by
Smith Paul
Home Financials for this Owner
Home Financials are based on the most recent Mortgage that was taken out on this home.
Original Mortgage
$114,200
Interest Rate
9%
Create a Home Valuation Report for This Property
The Home Valuation Report is an in-depth analysis detailing your home's value as well as a comparison with similar homes in the area
Home Values in the Area
Average Home Value in this Area
Purchase History
| Date | Buyer | Sale Price | Title Company |
|---|---|---|---|
| Francisca Talamantes Revocable Living Trust | -- | None Listed On Document | |
| Francisca Talamantes Revocable Living Trust | -- | None Listed On Document | |
| Talamantes Francisca | $202,000 | Landsafe Title | |
| Smith Paul | $127,000 | Fidelity National Title |
Source: Public Records
Mortgage History
| Date | Status | Borrower | Loan Amount |
|---|---|---|---|
| Previous Owner | Talamantes Francisca | $161,600 | |
| Previous Owner | Smith Paul | $114,200 | |
| Closed | Talamantes Francisca | $30,300 |
Source: Public Records
Tax History
| Year | Tax Paid | Tax Assessment Tax Assessment Total Assessment is a certain percentage of the fair market value that is determined by local assessors to be the total taxable value of land and additions on the property. | Land | Improvement |
|---|---|---|---|---|
| 2025 | $5,722 | $292,563 | $73,140 | $219,423 |
| 2024 | $5,331 | $286,827 | $71,706 | $215,121 |
| 2023 | $4,822 | $281,203 | $70,300 | $210,903 |
| 2022 | $4,719 | $275,690 | $68,922 | $206,768 |
| 2021 | $4,758 | $270,285 | $67,571 | $202,714 |
| 2020 | $4,735 | $267,513 | $66,878 | $200,635 |
| 2019 | $4,639 | $262,268 | $65,567 | $196,701 |
| 2018 | $4,556 | $257,125 | $64,281 | $192,844 |
| 2017 | $4,402 | $252,084 | $63,021 | $189,063 |
| 2016 | $4,448 | $247,141 | $61,785 | $185,356 |
| 2015 | $4,318 | $243,429 | $60,857 | $182,572 |
| 2014 | $4,186 | $238,661 | $59,665 | $178,996 |
Source: Public Records
Map
Nearby Homes
- 11541 Plane Tree Rd
- 11484 Lime Orchard Ln
- 11899 Briarcliff Ave
- 11355 Tondela St
- 15630 Willow Dr
- 11766 San Ribas Rd
- 15597 Castellion Rd
- 16200 Coleen St
- 15507 Coleen St
- 11504 Bell Tower Dr
- 16438 Gala Ave
- 15313 Coleen St
- 16597 Gala Ave
- 10881 Oleander Ave
- 14988 Long View Dr
- 11466 Blackstone Ct
- 11262 Sierra Ave
- 11308 Sherwood Ct
- 15798 Slover Ave
- 17049 La Vesu Rd
- 11627 Sparrow Dr
- 11639 Sparrow Dr
- 11621 Sparrow Dr
- 11645 Sparrow Dr
- 11615 Sparrow Dr
- 15878 Eagle Rd
- 15887 Eagle Rd
- 15877 Flamingo Dr
- 11609 Sparrow Dr
- 15872 Eagle Rd
- 15883 Eagle Rd
- 15877 Eagle Rd
- 15871 Flamingo Dr
- 15866 Eagle Rd
- 15871 Eagle Rd
- 11603 Sparrow Dr
- 15865 Flamingo Dr
- 15888 Flamingo Dr
- 15860 Eagle Rd
- 15865 Eagle Rd
Your Personal Tour Guide
Ask me questions while you tour the home.