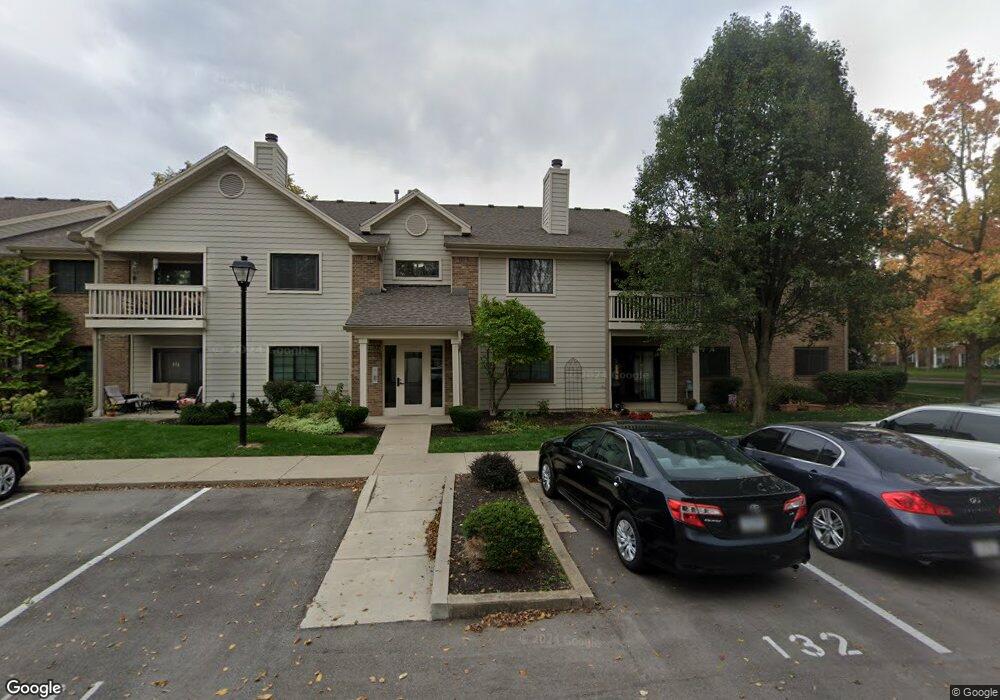
11635 Lenox Ln Unit 103 Carmel, IN 46032
Downtown Carmel NeighborhoodEstimated Value: $252,000 - $321,000
3
Beds
2
Baths
1,379
Sq Ft
$198/Sq Ft
Est. Value
About This Home
This home is located at 11635 Lenox Ln Unit 103, Carmel, IN 46032 and is currently estimated at $272,516, approximately $197 per square foot. 11635 Lenox Ln Unit 103 is a home located in Hamilton County with nearby schools including Carmel Elementary School, Carmel Middle School, and Carmel High School.
Ownership History
Date
Name
Owned For
Owner Type
Purchase Details
Closed on
Jan 26, 2022
Sold by
Healy Susan E
Bought by
Healy John E
Current Estimated Value
Purchase Details
Closed on
Nov 4, 2009
Sold by
Healy John E
Bought by
Healy Susan E and Healy John E
Purchase Details
Closed on
Jan 12, 2009
Sold by
Hedges Robert C and Hedges Susan E
Bought by
Healy John E
Home Financials for this Owner
Home Financials are based on the most recent Mortgage that was taken out on this home.
Original Mortgage
$127,319
Interest Rate
5.53%
Mortgage Type
FHA
Purchase Details
Closed on
Oct 31, 2007
Sold by
Shipman Gregory K and Shipman Brian D
Bought by
Hedges Robert C and Hedges Susan E
Home Financials for this Owner
Home Financials are based on the most recent Mortgage that was taken out on this home.
Original Mortgage
$122,459
Interest Rate
6.44%
Mortgage Type
VA
Purchase Details
Closed on
Aug 30, 2004
Sold by
Lawhead Leon
Bought by
Shipman June H
Create a Home Valuation Report for This Property
The Home Valuation Report is an in-depth analysis detailing your home's value as well as a comparison with similar homes in the area
Home Values in the Area
Average Home Value in this Area
Purchase History
| Date | Buyer | Sale Price | Title Company |
|---|---|---|---|
| Healy John E | -- | -- | |
| Healy John E | -- | -- | |
| Healy Susan E | -- | Hbi Title Services Inc | |
| Healy John E | -- | Hbi Title Services Inc | |
| Hedges Robert C | -- | None Available | |
| Shipman June H | -- | -- |
Source: Public Records
Mortgage History
| Date | Status | Borrower | Loan Amount |
|---|---|---|---|
| Previous Owner | Healy John E | $127,319 | |
| Previous Owner | Hedges Robert C | $122,459 |
Source: Public Records
Tax History Compared to Growth
Tax History
| Year | Tax Paid | Tax Assessment Tax Assessment Total Assessment is a certain percentage of the fair market value that is determined by local assessors to be the total taxable value of land and additions on the property. | Land | Improvement |
|---|---|---|---|---|
| 2024 | $2,078 | $213,200 | $47,700 | $165,500 |
| 2023 | $1,779 | $193,800 | $24,000 | $169,800 |
| 2022 | $1,880 | $188,700 | $24,000 | $164,700 |
| 2021 | $1,463 | $157,100 | $24,000 | $133,100 |
| 2020 | $1,208 | $138,200 | $24,000 | $114,200 |
| 2019 | $1,102 | $131,000 | $21,000 | $110,000 |
| 2018 | $947 | $121,200 | $21,000 | $100,200 |
| 2017 | $845 | $113,700 | $21,000 | $92,700 |
| 2016 | $753 | $105,000 | $21,000 | $84,000 |
| 2014 | $570 | $94,400 | $21,000 | $73,400 |
| 2013 | $570 | $100,600 | $21,000 | $79,600 |
Source: Public Records
Map
Nearby Homes
- 11635 Lenox Ln Unit 206
- 11715 Lenox Ln Unit 207
- 11777 Harvard Ln
- 11779 Yale Dr
- 772 Ivy Ln
- 11755 Beckham Ct Unit 206
- 12515 Timber Creek Dr Unit 8
- 12515 Timber Creek Dr Unit 1
- 12515 Timber Creek Dr Unit 9
- 12515 Timber Creek Dr
- 12517 Timber Creek Dr Unit 2
- 1414 E 116th St
- 1098 Timber Creek Dr Unit 2
- 11214 Ruckle St
- 489 Firefly Ln
- 451 American Way N Unit 1
- 420 Beverly Ct
- 1036 Cavendish Dr
- 621 E 111th St
- 910 Berkhamsted Ln
- 11635 Lenox Ln Unit 208
- 11635 Lenox Ln Unit 207
- 11635 Lenox Ln Unit 205
- 11635 Lenox Ln Unit 104
- 11635 Lenox Ln Unit 102
- 11635 Lenox Ln Unit 101
- 11635 Lenox Ln
- 11651 Lenox Trace Ln #103 Unit 103
- 11651 N Lenox Lane #206 Unit 7
- 11635 Lenox #207 Ln
- 962 Lenox Ln Unit 208
- 962 Lenox Ln Unit 207
- 962 Lenox Ln Unit 206
- 962 Lenox Ln Unit 205
- 962 Lenox Ln Unit 104
- 962 Lenox Ln Unit 103
- 962 Lenox Ln Unit 102
- 962 Lenox Ln Unit 101
- 962 Lenox Ln
- 11651 Lenox Ln Unit 208