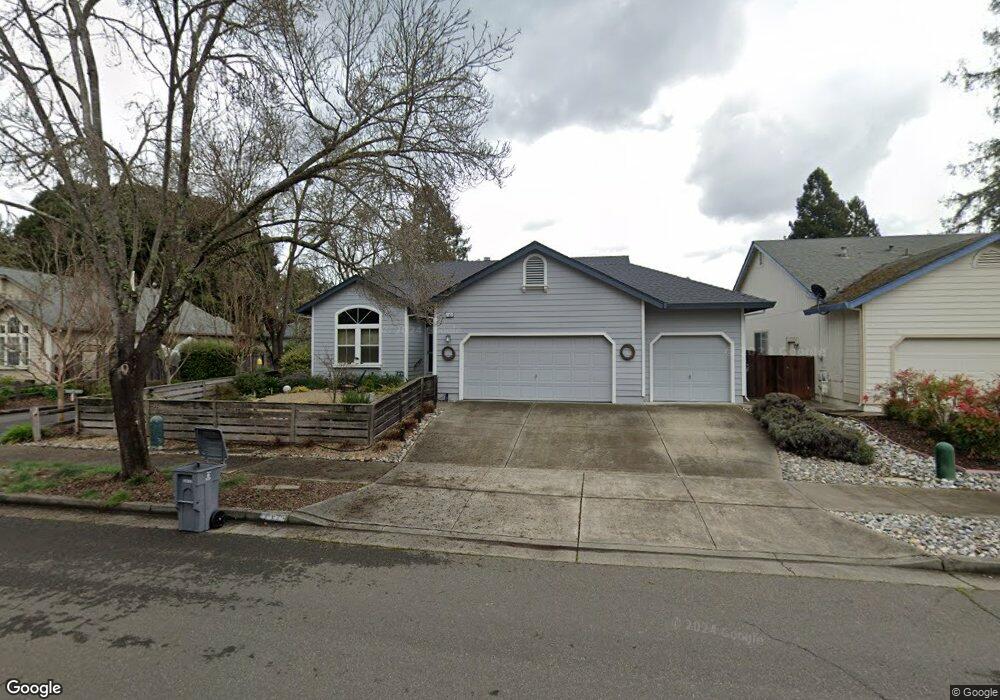
1164 Halyard Dr Santa Rosa, CA 95401
Northwest Santa Rosa NeighborhoodEstimated Value: $663,000 - $830,000
3
Beds
2
Baths
1,680
Sq Ft
$438/Sq Ft
Est. Value
About This Home
This home is located at 1164 Halyard Dr, Santa Rosa, CA 95401 and is currently estimated at $735,329, approximately $437 per square foot. 1164 Halyard Dr is a home located in Sonoma County with nearby schools including Albert F. Biella Elementary School, Hilliard Comstock Middle School, and Santa Rosa High School.
Ownership History
Date
Name
Owned For
Owner Type
Purchase Details
Closed on
Jan 28, 2015
Sold by
Rivas Jesus and Rivas Laurie V
Bought by
Keith & Gina Scribner Family Trust
Current Estimated Value
Purchase Details
Closed on
Sep 17, 2002
Sold by
Hackett Gregg
Bought by
Rivas Jesus and Rivas Laurie V
Home Financials for this Owner
Home Financials are based on the most recent Mortgage that was taken out on this home.
Original Mortgage
$292,000
Interest Rate
4.62%
Purchase Details
Closed on
Dec 16, 1999
Sold by
Messing Roswell and Messing Arlene M
Bought by
Hackett Gregg
Home Financials for this Owner
Home Financials are based on the most recent Mortgage that was taken out on this home.
Original Mortgage
$208,750
Interest Rate
7.5%
Purchase Details
Closed on
Sep 3, 1993
Sold by
Z 4 Development Corp
Bought by
Messing Roswell and Naschke Arlene M
Home Financials for this Owner
Home Financials are based on the most recent Mortgage that was taken out on this home.
Original Mortgage
$155,472
Interest Rate
6.75%
Create a Home Valuation Report for This Property
The Home Valuation Report is an in-depth analysis detailing your home's value as well as a comparison with similar homes in the area
Home Values in the Area
Average Home Value in this Area
Purchase History
| Date | Buyer | Sale Price | Title Company |
|---|---|---|---|
| Keith & Gina Scribner Family Trust | $433,000 | First American Title Company | |
| Rivas Jesus | $365,000 | North Bay Title Co | |
| Hackett Gregg | $261,000 | Fidelity National Title Co | |
| Messing Roswell | $194,500 | North Bay Title Co |
Source: Public Records
Mortgage History
| Date | Status | Borrower | Loan Amount |
|---|---|---|---|
| Previous Owner | Rivas Jesus | $292,000 | |
| Previous Owner | Hackett Gregg | $208,750 | |
| Previous Owner | Messing Roswell | $155,472 | |
| Closed | Hackett Gregg | $26,050 |
Source: Public Records
Tax History Compared to Growth
Tax History
| Year | Tax Paid | Tax Assessment Tax Assessment Total Assessment is a certain percentage of the fair market value that is determined by local assessors to be the total taxable value of land and additions on the property. | Land | Improvement |
|---|---|---|---|---|
| 2025 | $5,799 | $520,391 | $207,914 | $312,477 |
| 2024 | $5,799 | $510,188 | $203,838 | $306,350 |
| 2023 | $5,799 | $500,186 | $199,842 | $300,344 |
| 2022 | $5,353 | $490,379 | $195,924 | $294,455 |
| 2021 | $5,287 | $480,765 | $192,083 | $288,682 |
| 2020 | $5,275 | $475,836 | $190,114 | $285,722 |
| 2019 | $5,246 | $466,507 | $186,387 | $280,120 |
| 2018 | $5,216 | $457,361 | $182,733 | $274,628 |
| 2017 | $5,121 | $448,394 | $179,150 | $269,244 |
| 2016 | $5,083 | $439,603 | $175,638 | $263,965 |
| 2015 | $4,549 | $393,000 | $113,000 | $280,000 |
| 2014 | $3,444 | $310,000 | $89,000 | $221,000 |
Source: Public Records
Map
Nearby Homes
- 2318 S Hampton Cir
- 1185 Putney Dr
- 1520 Cabernet Cir
- 2311 Guerneville Rd
- 83 Somerset Dr
- 66 Somerset Dr
- 155 Shoreham Way
- 2455 Prairie Ln
- 1516 Wadsworth Ct
- 2423 Guerneville Rd
- 1552 Moonview Ct
- 127 Salisbury Cir
- 2467 College Park Cir
- 1532 Pinebrook Place
- 2484 College Park Cir
- 234 Arboleda Dr
- 2024 Elson Way
- 1721 Jennings Ave
- 1569 Yardley St
- 167 Sequoia Cir
- 1160 Halyard Dr
- 1168 Halyard Dr
- 1172 Halyard Dr
- 1170 Halyard Dr
- 1156 Halyard Dr
- 1165 Halyard Dr
- 2274 Coventry Ct
- 1174 Halyard Dr
- 1171 Halyard Dr
- 2322 S Hampton Cir
- 2270 Coventry Ct
- 1161 Halyard Dr
- 2273 Coventry Ct
- 1175 Halyard Dr
- 1178 Halyard Dr
- 1150 Halyard Dr
- 2266 Coventry Ct
- 2326 S Hampton Cir
- 2314 S Hampton Cir
- 1155 Halyard Dr