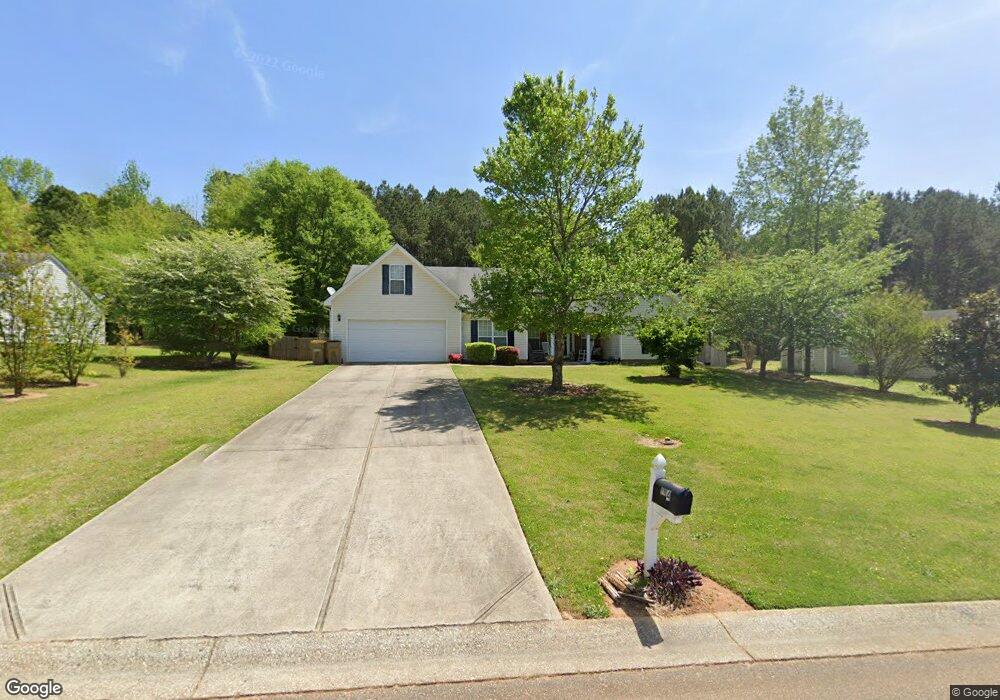
1164 Locust Dr Unit 3 Bethlehem, GA 30620
Estimated Value: $319,000 - $357,000
3
Beds
2
Baths
1,731
Sq Ft
$197/Sq Ft
Est. Value
About This Home
This home is located at 1164 Locust Dr Unit 3, Bethlehem, GA 30620 and is currently estimated at $341,098, approximately $197 per square foot. 1164 Locust Dr Unit 3 is a home located in Barrow County with nearby schools including Yargo Elementary School, Haymon-Morris Middle School, and Apalachee High School.
Ownership History
Date
Name
Owned For
Owner Type
Purchase Details
Closed on
Sep 17, 2003
Sold by
Southfork Hms Inc
Bought by
Sanders Judith R
Current Estimated Value
Home Financials for this Owner
Home Financials are based on the most recent Mortgage that was taken out on this home.
Original Mortgage
$111,400
Outstanding Balance
$50,739
Interest Rate
6.33%
Mortgage Type
New Conventional
Estimated Equity
$290,359
Purchase Details
Closed on
Aug 19, 2003
Sold by
Parkview Development Inc
Bought by
Southfork Homes Inc
Home Financials for this Owner
Home Financials are based on the most recent Mortgage that was taken out on this home.
Original Mortgage
$111,400
Outstanding Balance
$50,739
Interest Rate
6.33%
Mortgage Type
New Conventional
Estimated Equity
$290,359
Purchase Details
Closed on
May 2, 2000
Bought by
Parkview Development Inc
Create a Home Valuation Report for This Property
The Home Valuation Report is an in-depth analysis detailing your home's value as well as a comparison with similar homes in the area
Home Values in the Area
Average Home Value in this Area
Purchase History
| Date | Buyer | Sale Price | Title Company |
|---|---|---|---|
| Sanders Judith R | $139,300 | -- | |
| Southfork Homes Inc | $280,000 | -- | |
| Parkview Development Inc | -- | -- |
Source: Public Records
Mortgage History
| Date | Status | Borrower | Loan Amount |
|---|---|---|---|
| Open | Sanders Judith R | $111,400 |
Source: Public Records
Tax History
| Year | Tax Paid | Tax Assessment Tax Assessment Total Assessment is a certain percentage of the fair market value that is determined by local assessors to be the total taxable value of land and additions on the property. | Land | Improvement |
|---|---|---|---|---|
| 2025 | $1,015 | $128,791 | $25,200 | $103,591 |
| 2024 | $1,509 | $125,934 | $25,200 | $100,734 |
| 2023 | $1,115 | $126,534 | $25,200 | $101,334 |
| 2022 | $903 | $90,561 | $20,000 | $70,561 |
| 2021 | $722 | $80,740 | $16,000 | $64,740 |
| 2020 | $651 | $71,997 | $16,000 | $55,997 |
| 2019 | $679 | $71,997 | $16,000 | $55,997 |
| 2018 | $632 | $68,878 | $13,200 | $55,678 |
| 2017 | $1,721 | $59,114 | $13,200 | $45,914 |
| 2016 | $508 | $52,453 | $13,200 | $39,253 |
| 2015 | $516 | $52,853 | $13,200 | $39,653 |
| 2014 | $422 | $46,513 | $6,468 | $40,045 |
| 2013 | -- | $44,355 | $6,468 | $37,887 |
Source: Public Records
Map
Nearby Homes
- 763 Moss Side Dr
- 209 Angie Way
- 453 Tanners Bridge Rd Unit 5
- 1256 Loganville Hwy
- 1071 Covenant Ct
- 308 Meadows Dr
- 286 Meadows Dr
- 253 Meadows Dr
- 1129 Loganville Hwy
- 454 Grant Ct
- 0 J B Owens Lot 2 09ac Rd
- 0 J B Owens Lot 3 2 01ac Rd
- 1309 Tom Miller Rd
- 1111 Otis Dr
- 1188 Carl-Bethlehem Rd
- 404 Tanners Bridge Rd
- 449 Carl Bethlehem Rd SW
- 907 Downing Dr
- 923 Downing Dr
- 1202 Benton Ct
- 1164 Locust Dr Unit 26D
- 1166 Locust Dr
- 1166 Locust Dr Unit 25D
- 1166 Locust Dr
- 1162 Locust Dr Unit 3
- 1160 Locust Dr
- 1160 Locust Dr Unit 3
- 1168 Locust Dr Unit 3
- 563 Pin Oak Dr Unit 6D
- 563 Pin Oak Dr
- 561 Pin Oak Dr Unit 3
- 565 Pin Oak Dr
- 557 Pin Oak Dr Unit 4
- 557 Pin Oak Dr
- 553 Pin Oak Dr
- 1170 Locust Dr
- 1165 Locust Dr Unit 4C
- 1165 Locust Dr
- 549 Pin Oak Dr Unit 2D
- 549 Pin Oak Dr
Your Personal Tour Guide
Ask me questions while you tour the home.