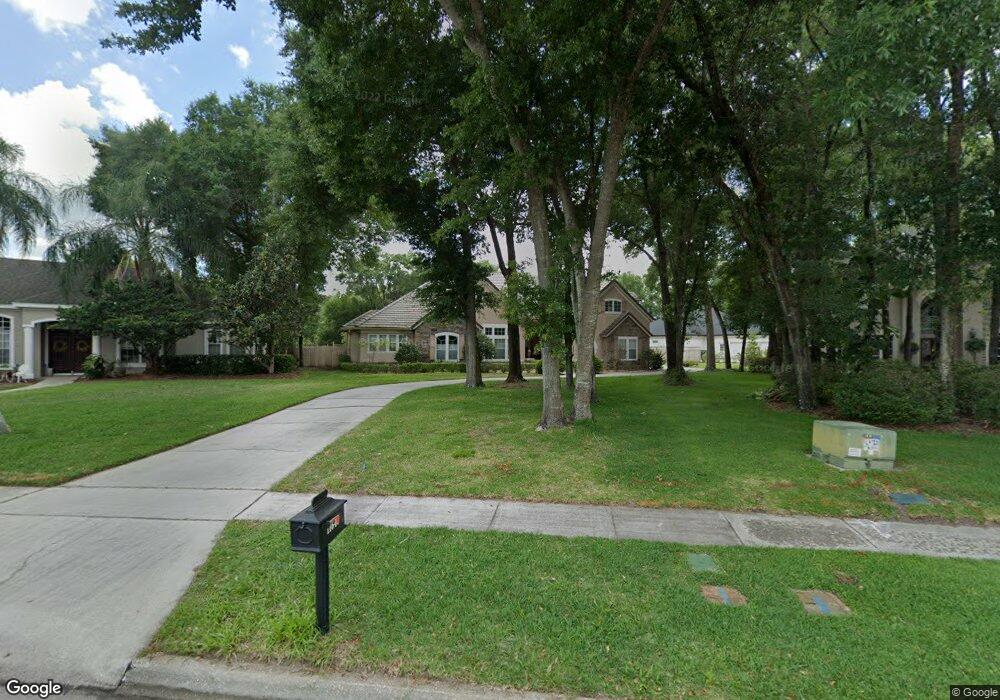
11643 Swift Water Cir Orlando, FL 32817
Estimated Value: $704,000 - $762,000
4
Beds
4
Baths
4,558
Sq Ft
$162/Sq Ft
Est. Value
About This Home
This home is located at 11643 Swift Water Cir, Orlando, FL 32817 and is currently estimated at $738,427, approximately $162 per square foot. 11643 Swift Water Cir is a home located in Orange County with nearby schools including Riverdale Elementary School, Corner Lake Middle School, and University High School.
Ownership History
Date
Name
Owned For
Owner Type
Purchase Details
Closed on
Jun 20, 2014
Sold by
Heidi Zoetzl
Bought by
Flammann Thorsten
Current Estimated Value
Purchase Details
Closed on
Apr 9, 2010
Sold by
Vazquez Carlos A and Vazquez Rosamelia
Bought by
Flammann Thorsten and Zoetzl Heidi
Home Financials for this Owner
Home Financials are based on the most recent Mortgage that was taken out on this home.
Original Mortgage
$332,000
Interest Rate
5.02%
Mortgage Type
New Conventional
Purchase Details
Closed on
Dec 17, 2002
Sold by
Ford Kenrick G and Ford Liliane E
Bought by
Vazquez Carlos A and Vazquez Rosamelia
Home Financials for this Owner
Home Financials are based on the most recent Mortgage that was taken out on this home.
Original Mortgage
$291,200
Interest Rate
6.08%
Mortgage Type
New Conventional
Create a Home Valuation Report for This Property
The Home Valuation Report is an in-depth analysis detailing your home's value as well as a comparison with similar homes in the area
Home Values in the Area
Average Home Value in this Area
Purchase History
| Date | Buyer | Sale Price | Title Company |
|---|---|---|---|
| Flammann Thorsten | $4,100 | None Listed On Document | |
| Flammann Thorsten | $415,000 | A N Title Inc | |
| Vazquez Carlos A | $364,000 | -- |
Source: Public Records
Mortgage History
| Date | Status | Borrower | Loan Amount |
|---|---|---|---|
| Previous Owner | Flammann Thorsten | $332,000 | |
| Previous Owner | Vazquez Carlos A | $291,200 |
Source: Public Records
Tax History Compared to Growth
Tax History
| Year | Tax Paid | Tax Assessment Tax Assessment Total Assessment is a certain percentage of the fair market value that is determined by local assessors to be the total taxable value of land and additions on the property. | Land | Improvement |
|---|---|---|---|---|
| 2025 | $10,175 | $663,300 | $75,000 | $588,300 |
| 2024 | $9,045 | $618,102 | -- | -- |
| 2023 | $9,045 | $596,808 | $75,000 | $521,808 |
| 2022 | $8,080 | $517,815 | $75,000 | $442,815 |
| 2021 | $7,243 | $422,172 | $65,000 | $357,172 |
| 2020 | $7,046 | $425,420 | $65,000 | $360,420 |
| 2019 | $7,258 | $414,307 | $80,000 | $334,307 |
| 2018 | $7,313 | $412,505 | $80,000 | $332,505 |
| 2017 | $6,870 | $382,537 | $57,500 | $325,037 |
| 2016 | $6,650 | $363,092 | $50,000 | $313,092 |
| 2015 | $6,719 | $358,807 | $50,000 | $308,807 |
| 2014 | $6,762 | $354,219 | $57,000 | $297,219 |
Source: Public Records
Map
Nearby Homes
- 4408 Calm Water Ct
- 4413 Riverton Dr
- 4605 Riverton Dr
- 3718 Rouse Rd
- Lot 7E Iron Bridge Rd
- 10805 Oak Glen Cir
- 3824 Greystone Legend Place
- 3718 Savannah Loop
- 10729 Oak Glen Cir
- 3650 Oakdale Cir Unit 100
- 3658 Oakdale Cir Unit 100
- 160 Reserve Cir Unit 100
- 144 Reserve Cir Unit 112
- 141 Reserve Cir Unit 113
- 172 Reserve Cir Unit 108
- 128 Reserve Cir Unit 208
- 100 Reserve Cir Unit 104
- 10544 Wyndcliff Dr
- 108 Reserve Cir Unit 108
- 10519 Wyndcliff Dr
- 11637 Swift Water Cir
- 11649 Swift Water Cir
- 4403 Calm Water Ct
- 11631 Swift Water Cir
- 4415 Calm Water Ct Unit 1
- 11642 Swift Water Cir
- 11655 Swift Water Cir
- 4402 Calm Water Ct
- 4009 Rouse Rd
- 11654 Swift Water Cir
- 11630 Swift Water Cir
- 4421 Calm Water Ct
- 11625 Swift Water Cir
- 4431 Liberty Bell Cove
- 11661 Swift Water Cir
- 4033 Rouse Rd
- 4437 Liberty Bell Cove
- 4425 Liberty Bell Cove
- 11660 Swift Water Cir Unit 1