11644 Miro Cir Unit 128 San Diego, CA 92131
Miramar Ranch North NeighborhoodEstimated Value: $880,539 - $1,069,000
3
Beds
3
Baths
1,458
Sq Ft
$669/Sq Ft
Est. Value
About This Home
This home is located at 11644 Miro Cir Unit 128, San Diego, CA 92131 and is currently estimated at $975,385, approximately $668 per square foot. 11644 Miro Cir Unit 128 is a home located in San Diego County with nearby schools including Miramar Ranch Elementary School, Thurgood Marshall Middle School, and Scripps Ranch High School.
Ownership History
Date
Name
Owned For
Owner Type
Purchase Details
Closed on
Apr 8, 2009
Sold by
Fong Donald and Fong Beverly
Bought by
Fong Donald and Fong Beverly
Current Estimated Value
Home Financials for this Owner
Home Financials are based on the most recent Mortgage that was taken out on this home.
Original Mortgage
$176,000
Outstanding Balance
$112,627
Interest Rate
5.17%
Mortgage Type
Stand Alone Refi Refinance Of Original Loan
Estimated Equity
$862,758
Purchase Details
Closed on
Feb 27, 2004
Sold by
Fong Donald and Fong Beverly
Bought by
Fong Donald and Fong Beverly
Purchase Details
Closed on
Sep 4, 2001
Sold by
Brookfield Villas Llc
Bought by
Fong Donald and Fong Beverly
Home Financials for this Owner
Home Financials are based on the most recent Mortgage that was taken out on this home.
Original Mortgage
$194,000
Interest Rate
7.05%
Mortgage Type
Purchase Money Mortgage
Create a Home Valuation Report for This Property
The Home Valuation Report is an in-depth analysis detailing your home's value as well as a comparison with similar homes in the area
Home Values in the Area
Average Home Value in this Area
Purchase History
| Date | Buyer | Sale Price | Title Company |
|---|---|---|---|
| Fong Donald | -- | Fidelity National Title | |
| Fong Donald | -- | Fidelity National Title Co | |
| Fong Donald | -- | -- | |
| Fong Donald | $243,500 | First American Title |
Source: Public Records
Mortgage History
| Date | Status | Borrower | Loan Amount |
|---|---|---|---|
| Open | Fong Donald | $176,000 | |
| Closed | Fong Donald | $194,000 |
Source: Public Records
Tax History Compared to Growth
Tax History
| Year | Tax Paid | Tax Assessment Tax Assessment Total Assessment is a certain percentage of the fair market value that is determined by local assessors to be the total taxable value of land and additions on the property. | Land | Improvement |
|---|---|---|---|---|
| 2025 | $4,629 | $359,550 | $118,172 | $241,378 |
| 2024 | $4,629 | $352,501 | $115,855 | $236,646 |
| 2023 | $4,520 | $345,590 | $113,584 | $232,006 |
| 2022 | $4,356 | $338,814 | $111,357 | $227,457 |
| 2021 | $4,318 | $332,172 | $109,174 | $222,998 |
| 2020 | $4,268 | $328,767 | $108,055 | $220,712 |
| 2019 | $4,432 | $322,322 | $105,937 | $216,385 |
| 2018 | $4,715 | $316,003 | $103,860 | $212,143 |
| 2017 | $4,636 | $309,808 | $101,824 | $207,984 |
| 2016 | $4,579 | $303,734 | $99,828 | $203,906 |
| 2015 | $4,526 | $299,173 | $98,329 | $200,844 |
| 2014 | $4,464 | $293,313 | $96,403 | $196,910 |
Source: Public Records
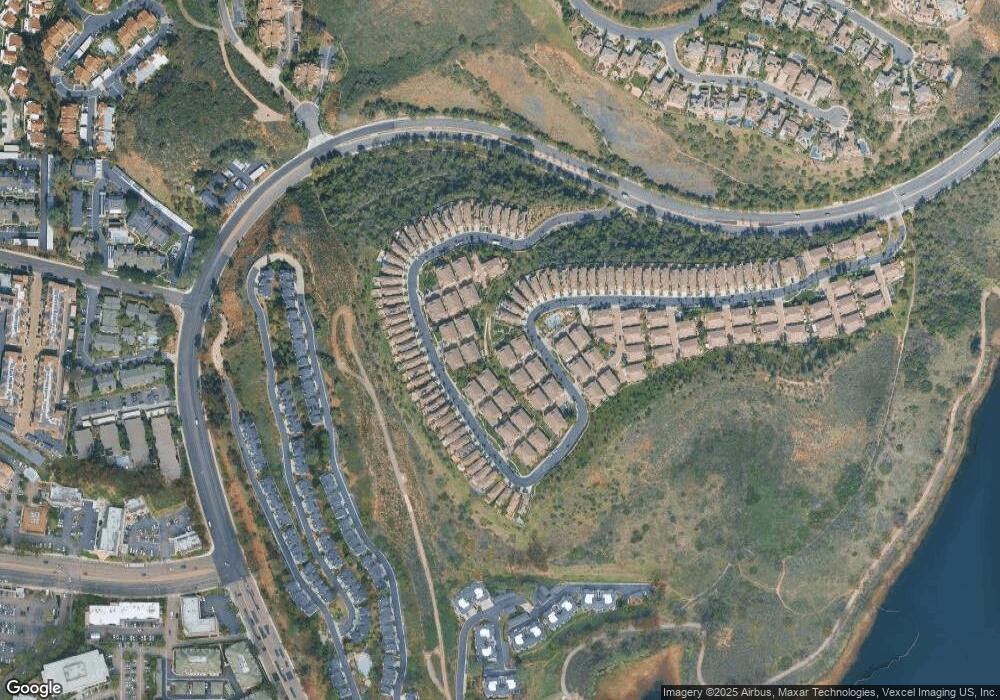
Map
Nearby Homes
- 11856 Miro Cir
- 11061 Scripps Ranch Blvd
- 11825 Miro Cir
- 11115 Affinity Ct Unit 1
- 9929 Erma Rd Unit 102
- 9939 Erma Rd Unit 101
- 11175 Affinity Ct Unit 45
- 11235 Affinity Ct Unit 68
- 11215 Affinity Ct Unit 80
- 11265 Affinity Ct Unit 103
- 9899 Scripps Westview Way Unit 243
- 9899 Scripps Westview Way Unit 244
- 9909 Scripps Westview Way Unit 212
- 11325 Affinity Ct Unit 151
- 11365 Affinity Ct Unit 192
- 9960 Scripps Vista Way Unit 116
- 11482 Cortina Place
- 11091 Ice Skate Place Unit 20
- 11629 Swan Lake Dr Unit 4
- 10466 Ridgewater Ln
- 11632 Miro Cir Unit 125
- 11674 Miro Cir
- 11672 Miro Cir Unit 122
- 11670 Miro Cir
- 11658 Miro Cir Unit 119
- 11660 Miro Cir Unit 118
- 11662 Miro Cir
- 11668 Miro Cir
- 11654 Miro Cir Unit 114
- 11652 Miro Cir
- 11650 Miro Cir
- 11432 Miro Cir
- 11564 Miro Cir
- 11562 Miro Cir
- 11560 Miro Cir
- 11636 Miro Cir
- 11638 Miro Cir Unit 131
- 11642 Miro Cir
- 11646 Miro Cir Unit 127
- 11656 Miro Cir Unit 120