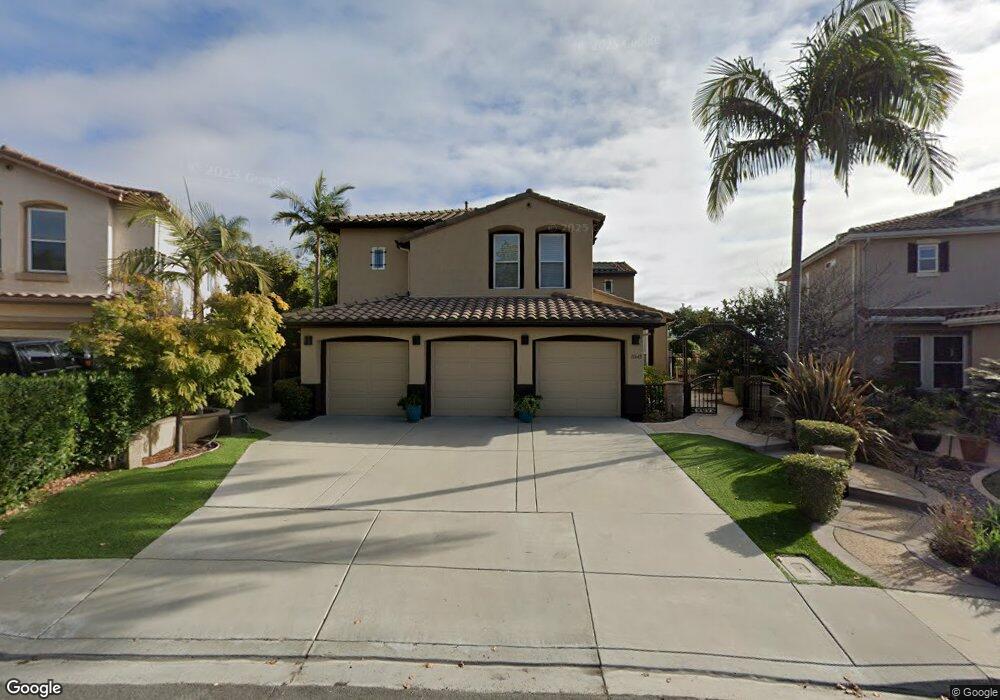
11645 Aldercrest Point San Diego, CA 92131
Miramar Ranch North NeighborhoodEstimated Value: $1,941,524 - $2,146,000
4
Beds
3
Baths
2,927
Sq Ft
$692/Sq Ft
Est. Value
About This Home
This home is located at 11645 Aldercrest Point, San Diego, CA 92131 and is currently estimated at $2,024,381, approximately $691 per square foot. 11645 Aldercrest Point is a home located in San Diego County with nearby schools including Scripps Elementary School, Thurgood Marshall Middle School, and Scripps Ranch High School.
Ownership History
Date
Name
Owned For
Owner Type
Purchase Details
Closed on
May 30, 2013
Sold by
Betyar Derek
Bought by
Erickson Matthew and Erickson Mary
Current Estimated Value
Home Financials for this Owner
Home Financials are based on the most recent Mortgage that was taken out on this home.
Original Mortgage
$417,000
Outstanding Balance
$297,684
Interest Rate
3.57%
Mortgage Type
New Conventional
Estimated Equity
$1,726,697
Purchase Details
Closed on
Oct 25, 2012
Sold by
Daly Darren E and Daly Cynthia A
Bought by
Betyar Derek
Purchase Details
Closed on
May 4, 1999
Sold by
S R V 2480 L L C
Bought by
Daly Darren E and Daly Cynthia A
Home Financials for this Owner
Home Financials are based on the most recent Mortgage that was taken out on this home.
Original Mortgage
$347,100
Interest Rate
7.84%
Create a Home Valuation Report for This Property
The Home Valuation Report is an in-depth analysis detailing your home's value as well as a comparison with similar homes in the area
Home Values in the Area
Average Home Value in this Area
Purchase History
| Date | Buyer | Sale Price | Title Company |
|---|---|---|---|
| Erickson Matthew | $920,000 | First American Title Company | |
| Betyar Derek | $361,255 | None Available | |
| Daly Darren E | $434,000 | First American Title |
Source: Public Records
Mortgage History
| Date | Status | Borrower | Loan Amount |
|---|---|---|---|
| Open | Erickson Matthew | $417,000 | |
| Previous Owner | Daly Darren E | $347,100 | |
| Closed | Daly Darren E | $43,350 |
Source: Public Records
Tax History Compared to Growth
Tax History
| Year | Tax Paid | Tax Assessment Tax Assessment Total Assessment is a certain percentage of the fair market value that is determined by local assessors to be the total taxable value of land and additions on the property. | Land | Improvement |
|---|---|---|---|---|
| 2025 | $13,911 | $1,127,783 | $425,357 | $702,426 |
| 2024 | $13,911 | $1,105,670 | $417,017 | $688,653 |
| 2023 | $13,593 | $1,083,991 | $408,841 | $675,150 |
| 2022 | $13,167 | $1,062,737 | $400,825 | $661,912 |
| 2021 | $13,063 | $1,041,900 | $392,966 | $648,934 |
| 2020 | $12,907 | $1,031,217 | $388,937 | $642,280 |
| 2019 | $13,146 | $1,010,998 | $381,311 | $629,687 |
| 2018 | $13,393 | $991,176 | $373,835 | $617,341 |
| 2017 | $80 | $971,742 | $366,505 | $605,237 |
| 2016 | $12,956 | $952,689 | $359,319 | $593,370 |
| 2015 | $12,790 | $938,380 | $353,922 | $584,458 |
| 2014 | $12,602 | $920,000 | $346,990 | $573,010 |
Source: Public Records
Map
Nearby Homes
- 11793 Alderhill Terrace
- 11954 Cypress Valley Dr
- 11964 Ashley Place
- 11495 Cypress Canyon Rd
- 11721 Treadwell Dr
- 11766 Treadwell Dr
- 12432 Caminito Brioso
- 11553 Trailbrook Ln Unit 2
- 10941 Waterton Rd
- 10976 Caminito Alto
- 11590 Trailbrook Ln
- 11393 Vista Elevada
- 10818 Caminito Arcada
- 12026 Medoc Ln
- 12676 Springbrook Dr Unit B
- 10914 Ivy Hill Dr Unit 1
- 12662 Springbrook Dr Unit D
- 12670 Springbrook Dr Unit D
- 12490 Heatherton Ct Unit 8
- 12626 Springbrook Dr Unit A
- 11651 Aldercrest Point Unit 9
- 11639 Aldercrest Point
- 11657 Aldercrest Point
- 11631 Aldercrest Point
- 11784 Alderhill Terrace
- 11663 Aldercrest Point
- 11652 Aldercrest Point
- 11772 Alderhill Terrace
- 11673 Aldercrest Point
- 11758 Alderhill Terrace
- 11801 Alderhill Terrace Unit 9
- 11685 Aldercrest Point
- 11815 Alderhill Terrace
- 11672 Aldercrest Point
- 11740 Alderhill Terrace
- 11823 Alderhill Terrace
- 11779 Alderhill Terrace Unit 9
- 11693 Aldercrest Point
- 11708 Aldercrest Point
- 11625 Enid Ct