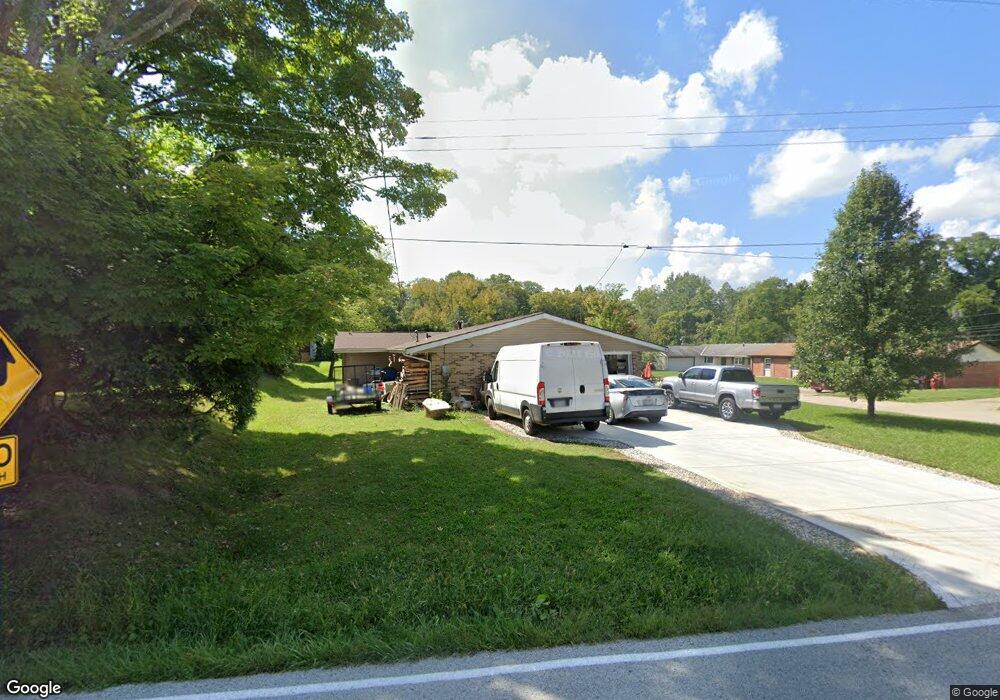
1165 Brush Row Rd Wilberforce, OH 45384
Estimated Value: $197,402 - $262,000
3
Beds
3
Baths
1,621
Sq Ft
$142/Sq Ft
Est. Value
About This Home
This home is located at 1165 Brush Row Rd, Wilberforce, OH 45384 and is currently estimated at $229,601, approximately $141 per square foot. 1165 Brush Row Rd is a home located in Greene County with nearby schools including Xenia High School.
Ownership History
Date
Name
Owned For
Owner Type
Purchase Details
Closed on
Oct 30, 2014
Sold by
Dickens Jonathan Michael and Dickens Jennifer M
Bought by
Branam Amy D
Current Estimated Value
Home Financials for this Owner
Home Financials are based on the most recent Mortgage that was taken out on this home.
Original Mortgage
$115,306
Outstanding Balance
$87,481
Interest Rate
4.21%
Mortgage Type
New Conventional
Estimated Equity
$142,120
Purchase Details
Closed on
Apr 27, 2012
Sold by
Dean Josiah and Dean Jessica L
Bought by
Dicken Jonathan Michael and Dicken Jennifer M
Home Financials for this Owner
Home Financials are based on the most recent Mortgage that was taken out on this home.
Original Mortgage
$99,000
Interest Rate
3.99%
Mortgage Type
VA
Purchase Details
Closed on
Aug 4, 2011
Sold by
Orourke William A
Bought by
Dean Josiah
Purchase Details
Closed on
Jul 29, 1999
Sold by
Davenport Alton A
Bought by
Orourke William A
Purchase Details
Closed on
Jun 17, 1998
Sold by
Estate Of Pinkie O Davenport
Bought by
Davenport Alton A
Create a Home Valuation Report for This Property
The Home Valuation Report is an in-depth analysis detailing your home's value as well as a comparison with similar homes in the area
Home Values in the Area
Average Home Value in this Area
Purchase History
| Date | Buyer | Sale Price | Title Company |
|---|---|---|---|
| Branam Amy D | $113,000 | None Available | |
| Dicken Jonathan Michael | $99,000 | None Available | |
| Dean Josiah | $43,600 | Attorney | |
| Orourke William A | -- | -- | |
| Davenport Alton A | -- | -- |
Source: Public Records
Mortgage History
| Date | Status | Borrower | Loan Amount |
|---|---|---|---|
| Open | Branam Amy D | $115,306 | |
| Previous Owner | Dicken Jonathan Michael | $99,000 |
Source: Public Records
Tax History
| Year | Tax Paid | Tax Assessment Tax Assessment Total Assessment is a certain percentage of the fair market value that is determined by local assessors to be the total taxable value of land and additions on the property. | Land | Improvement |
|---|---|---|---|---|
| 2025 | $2,287 | $45,760 | $3,350 | $42,410 |
| 2024 | $2,287 | $45,760 | $3,350 | $42,410 |
| 2023 | $2,268 | $45,760 | $3,350 | $42,410 |
| 2022 | $2,165 | $39,550 | $3,350 | $36,200 |
| 2021 | $2,192 | $39,550 | $3,350 | $36,200 |
| 2020 | $2,108 | $39,550 | $3,350 | $36,200 |
| 2019 | $2,174 | $38,370 | $3,350 | $35,020 |
| 2018 | $2,182 | $38,370 | $3,350 | $35,020 |
| 2017 | $2,017 | $38,370 | $3,350 | $35,020 |
| 2016 | $2,018 | $34,840 | $3,350 | $31,490 |
| 2015 | $2,022 | $34,840 | $3,350 | $31,490 |
| 2014 | $1,903 | $34,840 | $3,350 | $31,490 |
Source: Public Records
Map
Nearby Homes
- 1287 Brush Row Rd
- 1287 Brush Row Rd
- 1841 Marbella Ct
- 1831 Marbella Ct
- 1823 Marbella Ct
- 1856 Marbella Ct
- 1065 Clover Ct
- 1764 Highlander Dr
- 1030 Independence Dr
- 1020 Brooke Ln
- 1818 Highlander Dr
- 1138 Neeld Dr
- 955 Oak Dale Dr
- 1359 Eagles Way
- 1044 Whitestone Rd
- 1809 Palmer Ct
- 1556 N Regency Dr
- 1026 Trianon Dr
- 634 Martin Dr
- 1038 Lark Ln
- 1169 Brush Row Rd
- 1377 Garcia Dr
- 1388 Garcia Dr
- 1394 Garcia Dr
- 1178 Brush Row Rd
- 1382 Garcia Dr
- 1188 Brush Row Rd
- 1173 Brush Row Rd
- 1150 Simpson Dr
- 1164 Brush Row Rd
- 1376 Garcia Dr
- 1160 Simpson Dr
- 1164 Simpson Dr
- 1370 Garcia Dr
- 1165 Brush Row Rd
- 1149 Simpson Dr
- 1152 Brush Row Rd
- 1362 Garcia Dr
- 1192 Brush Row Rd
- 1152 Brush Row Rd
Your Personal Tour Guide
Ask me questions while you tour the home.