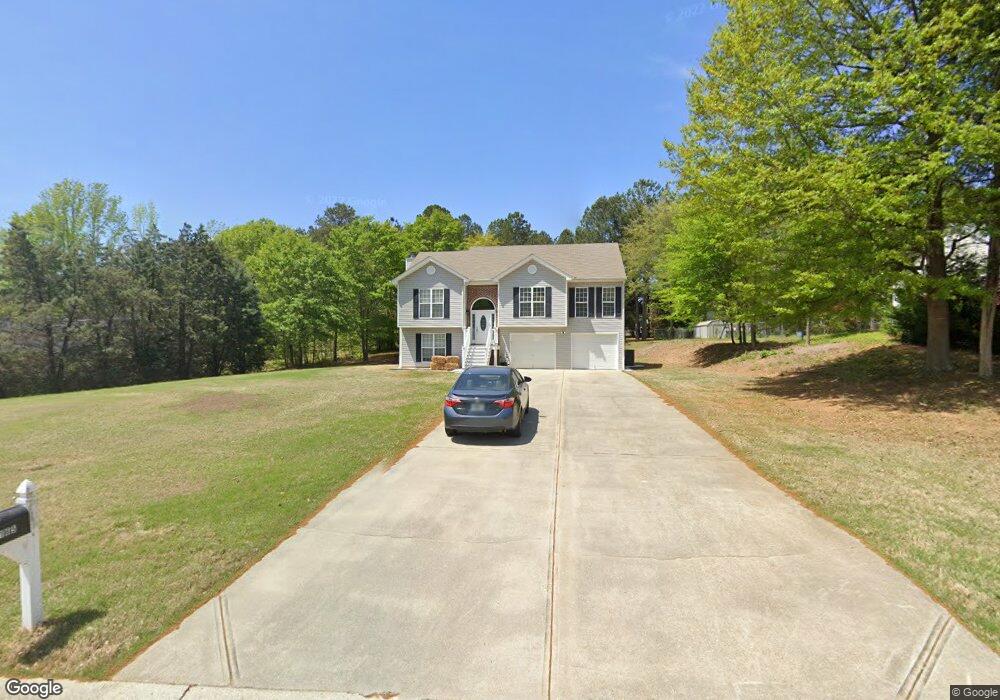
1165 Locust Dr Unit 4C Bethlehem, GA 30620
Estimated Value: $331,000 - $338,000
3
Beds
1
Bath
1,788
Sq Ft
$188/Sq Ft
Est. Value
About This Home
This home is located at 1165 Locust Dr Unit 4C, Bethlehem, GA 30620 and is currently estimated at $335,570, approximately $187 per square foot. 1165 Locust Dr Unit 4C is a home located in Barrow County with nearby schools including Yargo Elementary School, Haymon-Morris Middle School, and Apalachee High School.
Ownership History
Date
Name
Owned For
Owner Type
Purchase Details
Closed on
Mar 20, 2015
Sold by
Fontenot Joseph
Bought by
Babbie Trevis Allen
Current Estimated Value
Home Financials for this Owner
Home Financials are based on the most recent Mortgage that was taken out on this home.
Original Mortgage
$137,464
Outstanding Balance
$104,066
Interest Rate
3.37%
Mortgage Type
FHA
Estimated Equity
$231,504
Purchase Details
Closed on
Sep 19, 2012
Sold by
Rancho Investments Llc
Bought by
Fontenot Joseph and Fontenot Amanda
Purchase Details
Closed on
Jun 5, 2012
Sold by
Cain Randy L
Bought by
Rancho Investments Llc
Purchase Details
Closed on
Oct 6, 2003
Sold by
Southfork Hms Inc
Bought by
Cain Randy L
Home Financials for this Owner
Home Financials are based on the most recent Mortgage that was taken out on this home.
Original Mortgage
$131,478
Interest Rate
6.32%
Mortgage Type
VA
Purchase Details
Closed on
Sep 26, 2003
Sold by
Parkview Development Inc
Bought by
Southfork Homes Inc
Home Financials for this Owner
Home Financials are based on the most recent Mortgage that was taken out on this home.
Original Mortgage
$131,478
Interest Rate
6.32%
Mortgage Type
VA
Purchase Details
Closed on
May 2, 2000
Bought by
Parkview Development Inc
Create a Home Valuation Report for This Property
The Home Valuation Report is an in-depth analysis detailing your home's value as well as a comparison with similar homes in the area
Home Values in the Area
Average Home Value in this Area
Purchase History
| Date | Buyer | Sale Price | Title Company |
|---|---|---|---|
| Babbie Trevis Allen | $140,000 | -- | |
| Fontenot Joseph | $87,500 | -- | |
| Rancho Investments Llc | $46,889 | -- | |
| Cain Randy L | $128,900 | -- | |
| Southfork Homes Inc | $280,000 | -- | |
| Parkview Development Inc | -- | -- |
Source: Public Records
Mortgage History
| Date | Status | Borrower | Loan Amount |
|---|---|---|---|
| Open | Babbie Trevis Allen | $137,464 | |
| Previous Owner | Cain Randy L | $131,478 |
Source: Public Records
Tax History Compared to Growth
Tax History
| Year | Tax Paid | Tax Assessment Tax Assessment Total Assessment is a certain percentage of the fair market value that is determined by local assessors to be the total taxable value of land and additions on the property. | Land | Improvement |
|---|---|---|---|---|
| 2024 | $2,742 | $111,461 | $25,200 | $86,261 |
| 2023 | $2,339 | $112,061 | $25,200 | $86,861 |
| 2022 | $2,361 | $83,326 | $20,000 | $63,326 |
| 2021 | $2,184 | $73,054 | $16,000 | $57,054 |
| 2020 | $1,935 | $64,690 | $16,000 | $48,690 |
| 2019 | $1,967 | $64,690 | $16,000 | $48,690 |
| 2018 | $1,858 | $61,890 | $13,200 | $48,690 |
| 2017 | $1,538 | $52,830 | $13,200 | $39,630 |
| 2016 | $1,481 | $46,335 | $13,200 | $33,135 |
| 2015 | $1,367 | $46,700 | $13,200 | $33,500 |
| 2014 | $1,184 | $40,334 | $6,468 | $33,866 |
| 2013 | -- | $38,202 | $6,468 | $31,734 |
Source: Public Records
Map
Nearby Homes
- 0 Jb Owens Unit 7552902
- 0 Jb Owens Unit 7552891
- 0 Jb Owens Unit LOT 2 - 2.09 ACRES
- 0 Jb Owens Unit LOT 3 - 2.01 ACRES
- 190 Lokeys Ln
- 303 Ron Dr
- 0 Tanners Bridge Rd Unit 10588144
- 637 Sleeping Meadow Ln
- 763 Moss Side Dr
- The Barnes Plan at River Meadows
- The Paisley Plan at River Meadows
- The Rose II Plan at River Meadows
- The Logan Plan at River Meadows
- 209 Angie Way
- 286 Meadows Dr
- 1129 Loganville Hwy
- 758 Clarence Edwards Rd
- 1071 Covenant Ct
- 1111 Otis Dr
- 103 Camp Ct
- 1165 Locust Dr
- 1161 Locust Dr Unit 3C
- 1161 Locust Dr
- 1167 Locust Dr Unit 5C
- 1167 Locust Dr Unit 3
- 985 Camellia Ct Unit 10C
- 985 Camellia Ct
- 987 Camellia Ct
- 1159 Locust Dr
- 1159 Locust Dr
- 1159 Locust Dr Unit 3
- 1169 Locust Dr Unit 3
- 1162 Locust Dr Unit 3
- 983 Camellia Ct Unit 3
- 1164 Locust Dr Unit 26D
- 1164 Locust Dr Unit 3
- 537 Pin Oak Dr Unit 24C
- 537 Pin Oak Dr
- 1160 Locust Dr
- 1160 Locust Dr Unit 3