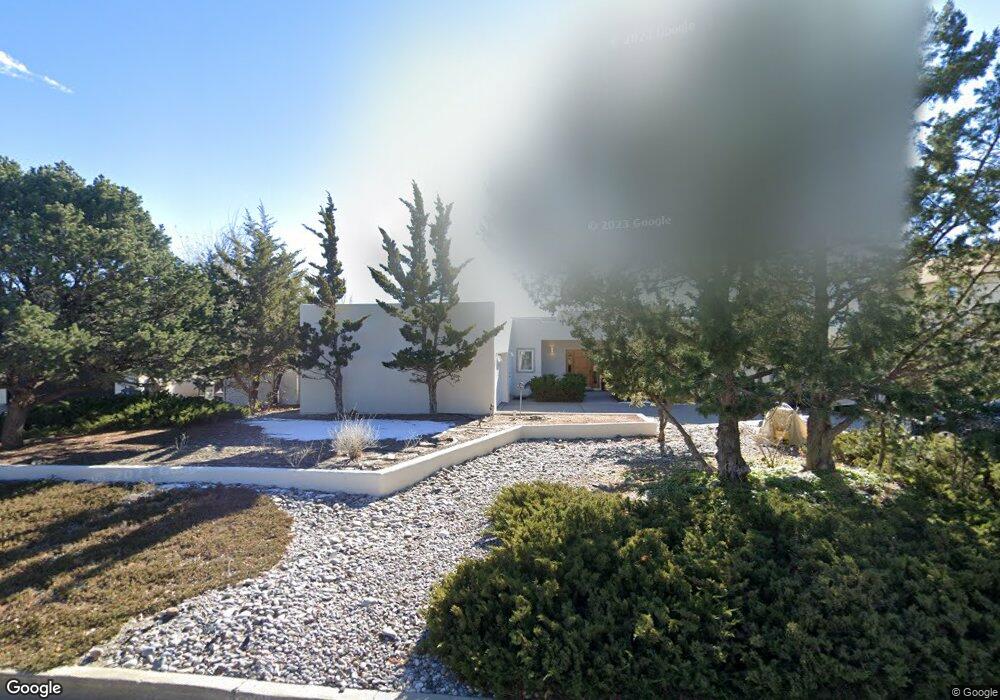
1165 Los Pueblos St Los Alamos, NM 87544
Estimated Value: $751,000 - $872,000
3
Beds
2
Baths
2,537
Sq Ft
$318/Sq Ft
Est. Value
About This Home
This home is located at 1165 Los Pueblos St, Los Alamos, NM 87544 and is currently estimated at $805,957, approximately $317 per square foot. 1165 Los Pueblos St is a home located in Los Alamos County with nearby schools including Barranca Mesa Elementary School, Los Alamos Middle School, and Los Alamos High School.
Ownership History
Date
Name
Owned For
Owner Type
Purchase Details
Closed on
Feb 27, 2020
Sold by
Mccabe Kevin Peter and Frigo Janette Rose
Bought by
Kaplan Alan Scott and Kaplan Casaundra Lynn
Current Estimated Value
Purchase Details
Closed on
Oct 21, 2010
Sold by
Mccabe Kevin Peter and Frigo Janette Rose
Bought by
Mccabe Kevin P and Frigo Janette Rose
Home Financials for this Owner
Home Financials are based on the most recent Mortgage that was taken out on this home.
Original Mortgage
$322,500
Interest Rate
4.39%
Mortgage Type
New Conventional
Purchase Details
Closed on
Oct 18, 2010
Sold by
Mccabe Kevin Peter and Frigo Janette Rose
Bought by
Frigo Janette Rose and Mccabe Kevin P
Home Financials for this Owner
Home Financials are based on the most recent Mortgage that was taken out on this home.
Original Mortgage
$322,500
Interest Rate
4.39%
Mortgage Type
New Conventional
Purchase Details
Closed on
Oct 27, 2005
Sold by
Mccabe Kevin Peter
Bought by
Mccabe Kevin Peter and Frig Janette Rose
Create a Home Valuation Report for This Property
The Home Valuation Report is an in-depth analysis detailing your home's value as well as a comparison with similar homes in the area
Home Values in the Area
Average Home Value in this Area
Purchase History
| Date | Buyer | Sale Price | Title Company |
|---|---|---|---|
| Kaplan Alan Scott | -- | None Available | |
| Mccabe Kevin P | -- | -- | |
| Frigo Janette Rose | -- | -- | |
| Mccabe Kevin Peter | -- | -- |
Source: Public Records
Mortgage History
| Date | Status | Borrower | Loan Amount |
|---|---|---|---|
| Previous Owner | Frigo Janette Rose | $322,500 |
Source: Public Records
Tax History Compared to Growth
Tax History
| Year | Tax Paid | Tax Assessment Tax Assessment Total Assessment is a certain percentage of the fair market value that is determined by local assessors to be the total taxable value of land and additions on the property. | Land | Improvement |
|---|---|---|---|---|
| 2025 | $5,242 | $222,850 | $51,600 | $171,250 |
| 2024 | $5,051 | $216,360 | $50,090 | $166,270 |
| 2023 | $4,994 | $210,070 | $48,720 | $161,350 |
| 2022 | $4,879 | $203,950 | $47,840 | $156,110 |
| 2021 | $4,767 | $198,000 | $47,030 | $150,970 |
| 2020 | $3,629 | $147,930 | $41,380 | $106,550 |
| 2019 | $3,426 | $139,490 | $40,770 | $98,720 |
| 2018 | $3,347 | $135,430 | $40,410 | $95,020 |
| 2017 | $3,267 | $131,480 | $41,520 | $89,960 |
| 2016 | $3,063 | $127,650 | $41,520 | $86,130 |
| 2015 | $2,979 | $123,940 | $44,720 | $79,220 |
| 2014 | $2,672 | $120,330 | $44,720 | $75,610 |
| 2013 | $2,818 | $127,700 | $48,610 | $79,090 |
| 2011 | $2,792 | $131,610 | $50,110 | $81,500 |
Source: Public Records
Map
Nearby Homes
- 1705 Los Pueblos St
- 1890 Los Pueblos St
- 585 Navajo Rd
- 10 Tesuque St
- 1276 Cheyenne St
- 1083 Cheyenne St
- 1015 Alamo Rd
- 945 San Ildefonso Rd Unit 16
- 964 Tsankawi St
- 972 Alamo Rd
- 917 Estates Dr
- 10 Terry Ln
- 435 Camino Cereza
- 1984 Camino Manzana
- 445 Rim Rd
- 1332 La Mirada Cir
- 1970 Camino Redondo
- 2176 La Tierra Rd
- 1071 Pinon Loop
- 1300 Iris St Unit 101
- 1135 Los Pueblos St
- 1195 Los Pueblos St
- 1150 Los Pueblos St
- 1180 Los Pueblos St
- 1225 Los Pueblos St
- 1105 Los Pueblos St
- 1210 Los Pueblos St
- 1120 Los Pueblos St
- 25 Bonito Place
- 1075 Los Pueblos St
- 1255 Los Pueblos St
- 1090 Los Pueblos St
- 15 Bonito Place
- 1285 Los Pueblos St
- 1045 Los Pueblos St
- 1060 Los Pueblos St
- 30 Bonito Place
- 10 Bonito Place
- 1315 Los Pueblos St
- 1030 Los Pueblos St