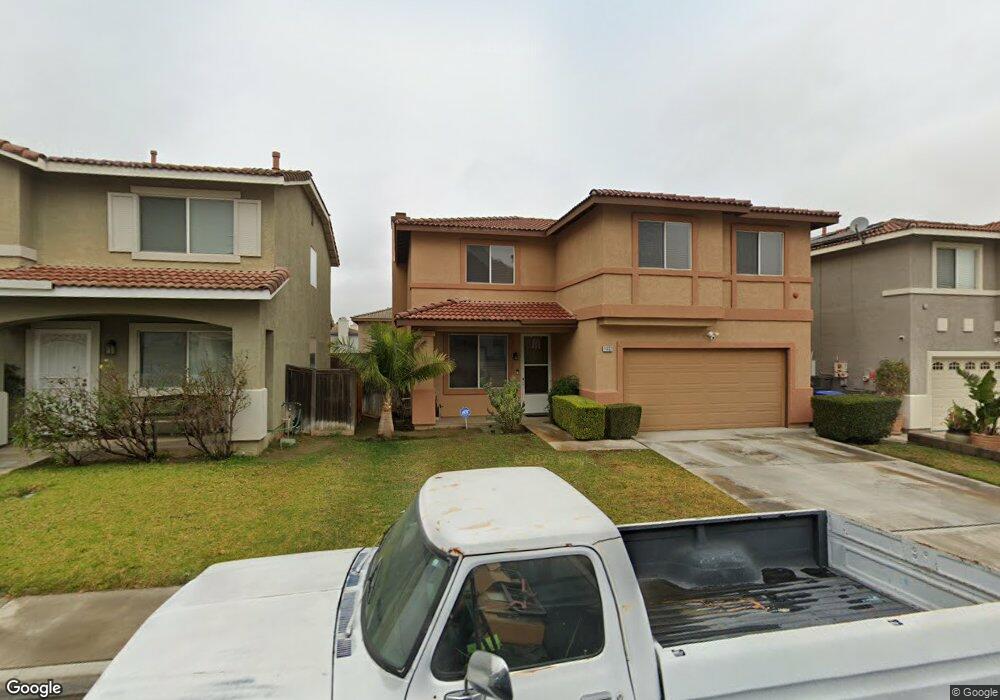
11652 Blue Jay Ln Fontana, CA 92337
Southridge Village NeighborhoodEstimated Value: $620,000 - $692,000
4
Beds
3
Baths
2,005
Sq Ft
$323/Sq Ft
Est. Value
About This Home
This home is located at 11652 Blue Jay Ln, Fontana, CA 92337 and is currently estimated at $647,147, approximately $322 per square foot. 11652 Blue Jay Ln is a home located in San Bernardino County with nearby schools including Jurupa Vista Elementary School, Ruth O. Harris Middle School, and Bloomington High School.
Ownership History
Date
Name
Owned For
Owner Type
Purchase Details
Closed on
Apr 17, 2002
Sold by
Durham Eric
Bought by
Durham Eric and Durham Trina
Current Estimated Value
Home Financials for this Owner
Home Financials are based on the most recent Mortgage that was taken out on this home.
Original Mortgage
$176,400
Outstanding Balance
$79,241
Interest Rate
7.99%
Estimated Equity
$567,906
Purchase Details
Closed on
Dec 10, 1998
Sold by
Durham Trina R
Bought by
Durham Eric
Home Financials for this Owner
Home Financials are based on the most recent Mortgage that was taken out on this home.
Original Mortgage
$137,700
Interest Rate
6.66%
Mortgage Type
VA
Purchase Details
Closed on
Dec 2, 1998
Sold by
Lewis Homes Enterprises
Bought by
Durham Eric
Home Financials for this Owner
Home Financials are based on the most recent Mortgage that was taken out on this home.
Original Mortgage
$137,700
Interest Rate
6.66%
Mortgage Type
VA
Create a Home Valuation Report for This Property
The Home Valuation Report is an in-depth analysis detailing your home's value as well as a comparison with similar homes in the area
Home Values in the Area
Average Home Value in this Area
Purchase History
| Date | Buyer | Sale Price | Title Company |
|---|---|---|---|
| Durham Eric | -- | Investors Title Company | |
| Durham Eric | -- | Fidelity National Title Ins | |
| Durham Eric | $135,000 | Fidelity National Title Ins |
Source: Public Records
Mortgage History
| Date | Status | Borrower | Loan Amount |
|---|---|---|---|
| Open | Durham Eric | $176,400 | |
| Closed | Durham Eric | $137,700 |
Source: Public Records
Tax History Compared to Growth
Tax History
| Year | Tax Paid | Tax Assessment Tax Assessment Total Assessment is a certain percentage of the fair market value that is determined by local assessors to be the total taxable value of land and additions on the property. | Land | Improvement |
|---|---|---|---|---|
| 2025 | $4,374 | $211,646 | $52,911 | $158,735 |
| 2024 | $4,374 | $207,497 | $51,874 | $155,623 |
| 2023 | $3,863 | $203,429 | $50,857 | $152,572 |
| 2022 | $3,773 | $199,440 | $49,860 | $149,580 |
| 2021 | $3,793 | $195,529 | $48,882 | $146,647 |
| 2020 | $3,765 | $193,524 | $48,381 | $145,143 |
| 2019 | $3,696 | $189,729 | $47,432 | $142,297 |
| 2018 | $3,628 | $186,009 | $46,502 | $139,507 |
| 2017 | $3,507 | $182,362 | $45,590 | $136,772 |
| 2016 | $3,530 | $178,786 | $44,696 | $134,090 |
| 2015 | $3,429 | $176,101 | $44,025 | $132,076 |
| 2014 | $3,328 | $172,652 | $43,163 | $129,489 |
Source: Public Records
Map
Nearby Homes
- 15849 Firethorn Rd
- 15793 Willow Dr
- 11415 Aberdeen Dr
- 15965 Peach Tree Ln
- 11355 Tondela St
- 16200 Coleen St
- 12022 Loyola Ct
- 15313 Coleen St
- 11460 Lone Tree Ct
- Plan 1666 at Parkview - Arbor at Parkview
- Plan 2000 at Parkview - Arbor at Parkview
- Plan 1877 at Parkview - Arbor at Parkview
- 14963 Colby Place
- 10881 Oleander Ave
- Plan 2056 at Parkview - Canopy at Parkview
- Plan 1791 at Parkview - Canopy at Parkview
- Plan 2320 at Parkview - Canopy at Parkview
- 14791 Mountain High Dr
- 11308 Sherwood Ct
- 11262 Sierra Ave
- 11646 Blue Jay Ln
- 11658 Blue Jay Ln
- 11649 Robin Dr
- 11643 Robin Dr
- 11664 Blue Jay Ln
- 11640 Blue Jay Ln
- 11655 Robin Dr
- 11637 Robin Dr
- 11661 Robin Dr
- 11670 Blue Jay Ln
- 11634 Blue Jay Ln
- 11651 Blue Jay Ln
- 11657 Blue Jay Ln
- 11645 Blue Jay Ln
- 11631 Robin Dr
- 11639 Blue Jay Ln
- 11676 Blue Jay Ln
- 11628 Blue Jay Ln
- 15767 Dove Ln
- 11633 Blue Jay Ln