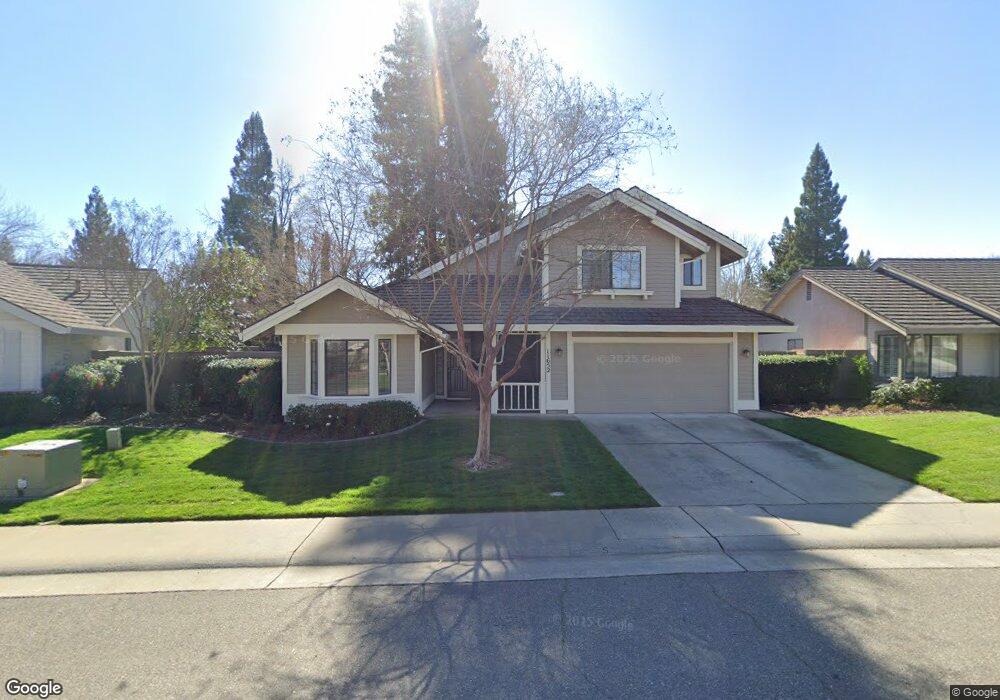
11652 Boom Pointer Way Gold River, CA 95670
Estimated Value: $605,569 - $695,000
4
Beds
3
Baths
2,118
Sq Ft
$309/Sq Ft
Est. Value
About This Home
This home is located at 11652 Boom Pointer Way, Gold River, CA 95670 and is currently estimated at $653,892, approximately $308 per square foot. 11652 Boom Pointer Way is a home located in Sacramento County with nearby schools including Gold River Discovery Center and Rio Americano High School.
Ownership History
Date
Name
Owned For
Owner Type
Purchase Details
Closed on
May 4, 2020
Sold by
Thuss Tanya
Bought by
Thuss Tanya A and Tanya & Michael Thuss Family T
Current Estimated Value
Home Financials for this Owner
Home Financials are based on the most recent Mortgage that was taken out on this home.
Original Mortgage
$243,300
Outstanding Balance
$216,401
Interest Rate
3.5%
Mortgage Type
New Conventional
Estimated Equity
$437,491
Purchase Details
Closed on
Oct 27, 2016
Sold by
Thuss Michael A and Thuss Tanya A
Bought by
Thuss Tanya A and The Tanya & Michael Thuss Fami
Purchase Details
Closed on
Dec 12, 1994
Sold by
Motherlode Village Ltd
Bought by
Thuss Michael A and Thuss Tanya A
Purchase Details
Closed on
Oct 6, 1994
Sold by
Kapandritis Gus N and Kapandritis Ana X
Bought by
Motherlode Village Ltd
Create a Home Valuation Report for This Property
The Home Valuation Report is an in-depth analysis detailing your home's value as well as a comparison with similar homes in the area
Home Values in the Area
Average Home Value in this Area
Purchase History
| Date | Buyer | Sale Price | Title Company |
|---|---|---|---|
| Thuss Tanya A | -- | Stewart Title Of Sacramento | |
| Thuss Tanya | -- | Stewart Title | |
| Thuss Tanya A | -- | None Available | |
| Thuss Michael A | $203,000 | Chicago Title Company | |
| Motherlode Village Ltd | $191,500 | Chicago Title Company |
Source: Public Records
Mortgage History
| Date | Status | Borrower | Loan Amount |
|---|---|---|---|
| Open | Thuss Tanya | $243,300 |
Source: Public Records
Tax History
| Year | Tax Paid | Tax Assessment Tax Assessment Total Assessment is a certain percentage of the fair market value that is determined by local assessors to be the total taxable value of land and additions on the property. | Land | Improvement |
|---|---|---|---|---|
| 2025 | $4,136 | $340,950 | $109,165 | $231,785 |
| 2024 | $4,136 | $334,266 | $107,025 | $227,241 |
| 2023 | $4,031 | $327,713 | $104,927 | $222,786 |
| 2022 | $4,006 | $321,288 | $102,870 | $218,418 |
| 2021 | $3,939 | $314,989 | $100,853 | $214,136 |
| 2020 | $3,780 | $311,760 | $99,819 | $211,941 |
| 2019 | $3,702 | $305,648 | $97,862 | $207,786 |
| 2018 | $3,656 | $299,656 | $95,944 | $203,712 |
| 2017 | $3,617 | $293,781 | $94,063 | $199,718 |
| 2016 | $3,332 | $288,021 | $92,219 | $195,802 |
| 2015 | $3,274 | $283,695 | $90,834 | $192,861 |
| 2014 | $3,205 | $278,139 | $89,055 | $189,084 |
Source: Public Records
Map
Nearby Homes
- 2050 Campton Cir
- 11775 Beaver Bar Ct
- 2024 Empire Mine Cir
- 1957 Empire Oaks Ct
- 2046 Texas Bar Ct
- 11476 Hesperian Cir
- 11474 Round House Ct
- 11704 Old Eureka Way
- 11430 Coloma Rd
- 1954 D O Mills Ct
- 11444 Gold Country Blvd
- 11871 Silver Cliff Way
- 11440 Sutters Mill Cir
- 2342 Cabo Way
- 11864 S Carson Way
- 11909 Rising Sun Way
- 11931 Old Eureka Way
- 2210 Railway Cir
- 11939 Old Eureka Way
- 11950 Rising Sun Way
- 11648 Boom Pointer Way
- 11656 Boom Pointer Way
- 11641 Heavytree Ct
- 2091 Roaring Camp Dr
- 11647 Heavytree Ct
- 11644 Boom Pointer Way
- 11651 Boom Pointer Way
- 11637 Heavytree Ct
- 2103 Roaring Camp Dr
- 11647 Boom Pointer Way
- 11640 Boom Pointer Way
- 11655 Heavytree Ct
- 11633 Heavytree Ct
- 11641 Boom Pointer Way
- 2098 Roaring Camp Dr
- 2102 Roaring Camp Dr
- 11652 Red Gulch Ct
- 2107 Roaring Camp Dr
- 2094 Roaring Camp Dr
- 11636 Boom Pointer Way
Your Personal Tour Guide
Ask me questions while you tour the home.