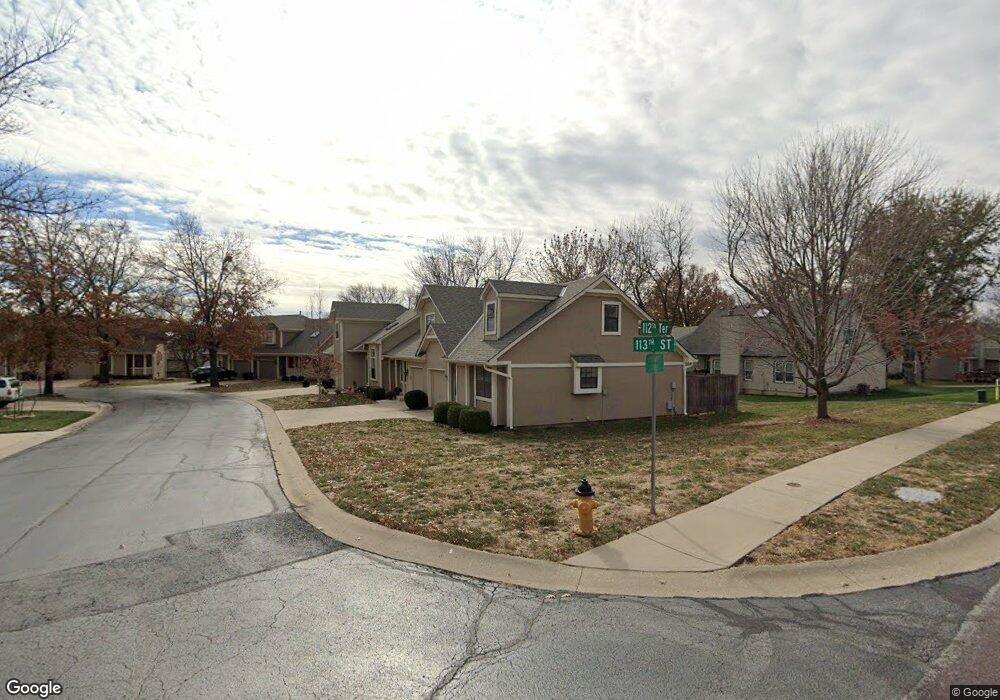
11653 W 113th St Overland Park, KS 66210
Central Overland Park NeighborhoodEstimated Value: $249,000 - $258,000
2
Beds
2
Baths
1,035
Sq Ft
$245/Sq Ft
Est. Value
About This Home
This home is located at 11653 W 113th St, Overland Park, KS 66210 and is currently estimated at $253,667, approximately $245 per square foot. 11653 W 113th St is a home located in Johnson County with nearby schools including Pleasant Ridge Elementary School, California Trail Middle School, and Olathe East Sr High School.
Ownership History
Date
Name
Owned For
Owner Type
Purchase Details
Closed on
Mar 16, 2006
Sold by
Primacy Closing Corp
Bought by
Rosson Robert A
Current Estimated Value
Home Financials for this Owner
Home Financials are based on the most recent Mortgage that was taken out on this home.
Original Mortgage
$72,800
Outstanding Balance
$39,498
Interest Rate
5.5%
Mortgage Type
Adjustable Rate Mortgage/ARM
Estimated Equity
$214,169
Purchase Details
Closed on
Jan 20, 2006
Sold by
Schmieder Karla A
Bought by
Primacy Closing Corp
Home Financials for this Owner
Home Financials are based on the most recent Mortgage that was taken out on this home.
Original Mortgage
$72,800
Outstanding Balance
$39,498
Interest Rate
5.5%
Mortgage Type
Adjustable Rate Mortgage/ARM
Estimated Equity
$214,169
Purchase Details
Closed on
Sep 25, 2002
Sold by
Kahler Mark R and Kahler Rebecca A
Bought by
Schmieder Karla A
Home Financials for this Owner
Home Financials are based on the most recent Mortgage that was taken out on this home.
Original Mortgage
$113,172
Interest Rate
6.21%
Mortgage Type
FHA
Create a Home Valuation Report for This Property
The Home Valuation Report is an in-depth analysis detailing your home's value as well as a comparison with similar homes in the area
Home Values in the Area
Average Home Value in this Area
Purchase History
| Date | Buyer | Sale Price | Title Company |
|---|---|---|---|
| Rosson Robert A | -- | Stewart Title | |
| Primacy Closing Corp | -- | Stewart Title | |
| Schmieder Karla A | -- | Multiple |
Source: Public Records
Mortgage History
| Date | Status | Borrower | Loan Amount |
|---|---|---|---|
| Open | Rosson Robert A | $72,800 | |
| Previous Owner | Primacy Closing Corp | $72,800 | |
| Previous Owner | Schmieder Karla A | $113,172 |
Source: Public Records
Tax History Compared to Growth
Tax History
| Year | Tax Paid | Tax Assessment Tax Assessment Total Assessment is a certain percentage of the fair market value that is determined by local assessors to be the total taxable value of land and additions on the property. | Land | Improvement |
|---|---|---|---|---|
| 2024 | $2,745 | $25,806 | $4,692 | $21,114 |
| 2023 | $2,732 | $24,909 | $4,692 | $20,217 |
| 2022 | $2,542 | $22,701 | $3,910 | $18,791 |
| 2021 | $2,262 | $19,090 | $3,260 | $15,830 |
| 2020 | $2,209 | $18,641 | $3,260 | $15,381 |
| 2019 | $2,216 | $18,561 | $3,260 | $15,301 |
| 2018 | $1,860 | $17,549 | $3,260 | $14,289 |
| 2017 | $1,885 | $15,571 | $2,415 | $13,156 |
| 2016 | $1,800 | $15,238 | $2,415 | $12,823 |
| 2015 | $1,609 | $13,800 | $2,415 | $11,385 |
| 2013 | -- | $14,237 | $2,415 | $11,822 |
Source: Public Records
Map
Nearby Homes
- 11224 Nieman Rd Unit 202
- 11632 Cody St
- 11626 Monrovia St
- 10812 W 116th St
- 17044 Earnshaw St
- 17028 Earnshaw St
- 17100 Earnshaw St
- 17313 Earnshaw St
- 17308 Earnshaw St
- 11727 Caenen St
- 12653 W 110th Terrace
- 12659 W 110th Terrace
- 12623 W 110th Terrace
- 12618 W 110th Terrace
- 12641 W 110th Terrace
- 11445 W 106th St
- 10853 Rosehill Rd
- 10863 Rosehill Rd
- 12696 W 108th Terrace
- 10997 Rosehill Rd
- 11649 W 113th St
- 11645 W 113th St
- 11641 W 113th St
- 11632 W 113th St
- 11636 W 113th St
- 11247 Garnett St
- 11640 W 113th St
- 11644 W 113th St
- 11637 W 113th St
- 11251 Garnett St
- 11800 W 112th Terrace
- 11633 W 113th St
- 11616 W 113th St
- 11620 W 113th St
- 11629 W 113th St
- 11624 W 113th St
- 11255 Garnett St
- 11625 W 113th St
- 11628 W 113th St
- 11808 W 112th Terrace