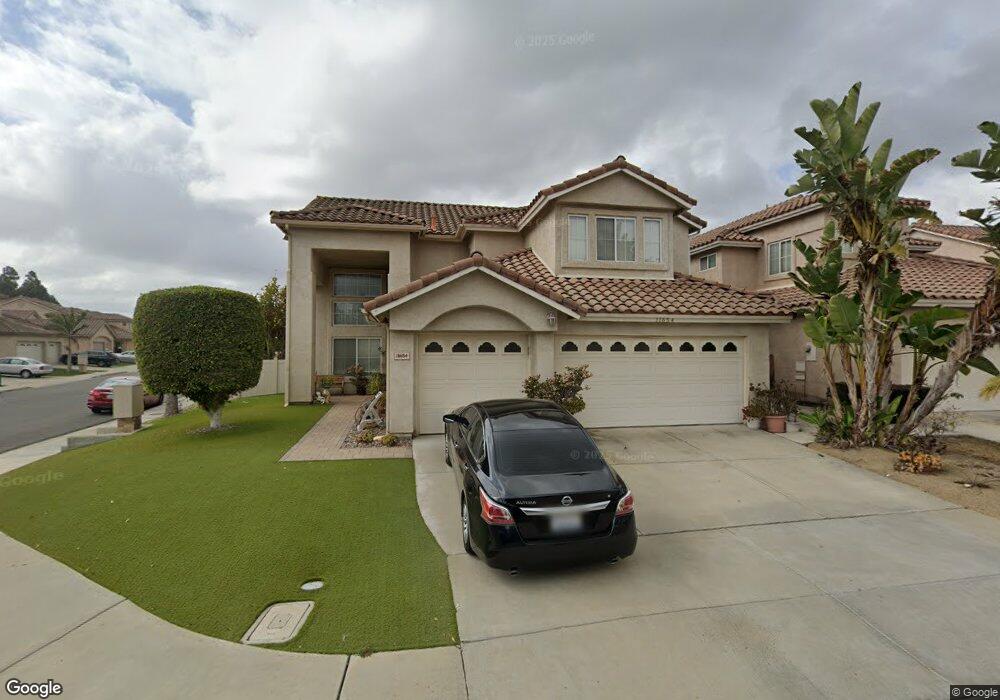
11654 Frames Port Place Unit 3 San Diego, CA 92126
Mira Mesa NeighborhoodEstimated Value: $1,271,000 - $1,457,000
5
Beds
3
Baths
2,165
Sq Ft
$628/Sq Ft
Est. Value
About This Home
This home is located at 11654 Frames Port Place Unit 3, San Diego, CA 92126 and is currently estimated at $1,358,831, approximately $627 per square foot. 11654 Frames Port Place Unit 3 is a home located in San Diego County with nearby schools including Sandburg Elementary School, Challenger Middle School, and Mira Mesa High School.
Ownership History
Date
Name
Owned For
Owner Type
Purchase Details
Closed on
Apr 13, 2003
Sold by
Truong Buu and Nguyen Xinh
Bought by
Erese Daniel A and Erese Amalia A
Current Estimated Value
Home Financials for this Owner
Home Financials are based on the most recent Mortgage that was taken out on this home.
Original Mortgage
$432,000
Outstanding Balance
$186,810
Interest Rate
5.84%
Estimated Equity
$1,172,021
Purchase Details
Closed on
Feb 15, 2002
Sold by
Nepomuceno Silverio D and Nepomuceno Beatriz B
Bought by
Truong Buu and Nguyen Xinh
Home Financials for this Owner
Home Financials are based on the most recent Mortgage that was taken out on this home.
Original Mortgage
$360,000
Interest Rate
6.87%
Purchase Details
Closed on
Feb 4, 1994
Sold by
The Fieldstone Company
Bought by
Nepomuceno Silverio D and Nepomuceno Beatriz B
Home Financials for this Owner
Home Financials are based on the most recent Mortgage that was taken out on this home.
Original Mortgage
$207,850
Interest Rate
4.5%
Create a Home Valuation Report for This Property
The Home Valuation Report is an in-depth analysis detailing your home's value as well as a comparison with similar homes in the area
Home Values in the Area
Average Home Value in this Area
Purchase History
| Date | Buyer | Sale Price | Title Company |
|---|---|---|---|
| Erese Daniel A | $540,000 | Fidelity National Title | |
| Truong Buu | $450,000 | Stewart Title | |
| Nepomuceno Silverio D | $231,000 | First American Title |
Source: Public Records
Mortgage History
| Date | Status | Borrower | Loan Amount |
|---|---|---|---|
| Open | Erese Daniel A | $432,000 | |
| Previous Owner | Truong Buu | $360,000 | |
| Previous Owner | Nepomuceno Silverio D | $207,850 | |
| Closed | Erese Daniel A | $54,000 |
Source: Public Records
Tax History Compared to Growth
Tax History
| Year | Tax Paid | Tax Assessment Tax Assessment Total Assessment is a certain percentage of the fair market value that is determined by local assessors to be the total taxable value of land and additions on the property. | Land | Improvement |
|---|---|---|---|---|
| 2025 | $9,557 | $782,078 | $470,696 | $311,382 |
| 2024 | $9,557 | $766,744 | $461,467 | $305,277 |
| 2023 | $9,340 | $751,711 | $452,419 | $299,292 |
| 2022 | $9,083 | $736,973 | $443,549 | $293,424 |
| 2021 | $9,010 | $722,523 | $434,852 | $287,671 |
| 2020 | $8,899 | $715,116 | $430,394 | $284,722 |
| 2019 | $8,739 | $701,095 | $421,955 | $279,140 |
| 2018 | $8,173 | $687,349 | $413,682 | $273,667 |
| 2017 | $7,969 | $673,872 | $405,571 | $268,301 |
| 2016 | $7,843 | $660,660 | $397,619 | $263,041 |
| 2015 | $7,728 | $650,737 | $391,647 | $259,090 |
| 2014 | $6,570 | $550,000 | $330,000 | $220,000 |
Source: Public Records
Map
Nearby Homes
- 11550 Caminito la Bar Unit 118
- 11545 Caminito la Bar Unit 74
- 7444 Mason Heights Ln
- 7636 Acama St
- 7646 Acama St
- 7758 Prairie Shadow Rd
- 7385 Calle Cristobal Unit 225
- 7365 Calle Cristobal Unit 197
- 7349 Calle Cristobal Unit 181
- 11319 Caminito Rodar
- 11311 Caminito Rodar
- 11324 Caminito Rodar
- 11318 Caminito Rodar
- 11265 Caminito Aclara
- 7220 Calle Cristobal Unit 12
- 11629 Thomas Hayes Ln
- 8054 Los Sabalos St
- 8141 Calle Nueva
- 7561 Windsong Rd
- 11343 Avenida Del Gato
- 11658 Frames Port Place
- 11653 Vietta Terrace
- 11662 Frames Port Place
- 11661 Vietta Terrace
- 11667 Vietta Terrace
- 7547 Raven Ridge Point
- 11668 Frames Port Place Unit 3
- 7545 Raven Ridge Point
- 11671 Vietta Terrace
- 7543 Raven Ridge Point
- 11655 Frames Port Place
- 11631 Frames Port Place
- 11672 Frames Port Place
- 11659 Frames Port Place
- 11641 Frames Port Place
- 11677 Vietta Terrace
- 11665 Frames Port Place
- 7539 Raven Ridge Point
- 11660 Vietta Terrace
- 11621 Frames Port Place