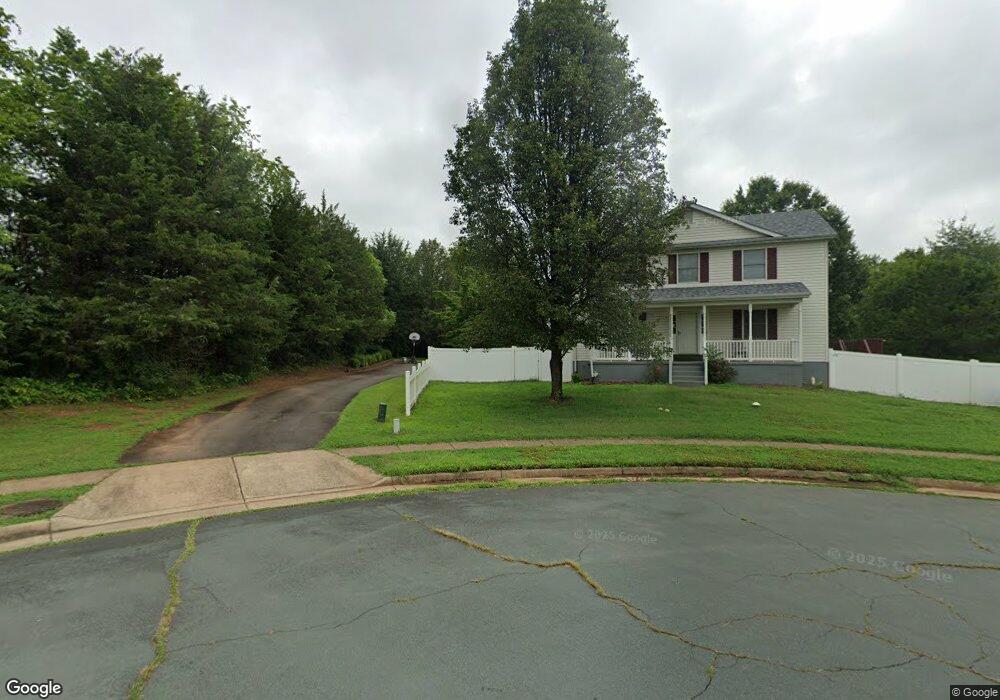
11655 Flag Rock Dr Remington, VA 22734
Estimated Value: $418,000 - $460,000
3
Beds
2
Baths
1,423
Sq Ft
$309/Sq Ft
Est. Value
About This Home
This home is located at 11655 Flag Rock Dr, Remington, VA 22734 and is currently estimated at $439,051, approximately $308 per square foot. 11655 Flag Rock Dr is a home located in Fauquier County with nearby schools including Margaret M. Pierce Elementary School, Cedar Lee Middle School, and Liberty High School.
Ownership History
Date
Name
Owned For
Owner Type
Purchase Details
Closed on
Dec 14, 2001
Sold by
Barb R M Construction Co
Bought by
Chinault David W
Current Estimated Value
Home Financials for this Owner
Home Financials are based on the most recent Mortgage that was taken out on this home.
Original Mortgage
$121,560
Outstanding Balance
$47,606
Interest Rate
6.6%
Estimated Equity
$391,445
Create a Home Valuation Report for This Property
The Home Valuation Report is an in-depth analysis detailing your home's value as well as a comparison with similar homes in the area
Home Values in the Area
Average Home Value in this Area
Purchase History
| Date | Buyer | Sale Price | Title Company |
|---|---|---|---|
| Chinault David W | $151,950 | -- |
Source: Public Records
Mortgage History
| Date | Status | Borrower | Loan Amount |
|---|---|---|---|
| Open | Chinault David W | $121,560 |
Source: Public Records
Tax History Compared to Growth
Tax History
| Year | Tax Paid | Tax Assessment Tax Assessment Total Assessment is a certain percentage of the fair market value that is determined by local assessors to be the total taxable value of land and additions on the property. | Land | Improvement |
|---|---|---|---|---|
| 2025 | $3,610 | $373,300 | $90,000 | $283,300 |
| 2024 | $3,534 | $373,300 | $90,000 | $283,300 |
| 2023 | $3,385 | $373,300 | $90,000 | $283,300 |
| 2022 | $3,385 | $373,300 | $90,000 | $283,300 |
| 2021 | $2,753 | $275,600 | $90,000 | $185,600 |
| 2020 | $2,753 | $275,600 | $90,000 | $185,600 |
| 2019 | $2,753 | $275,600 | $90,000 | $185,600 |
| 2018 | $2,720 | $275,600 | $90,000 | $185,600 |
| 2016 | $2,045 | $195,500 | $70,000 | $125,500 |
| 2015 | -- | $195,500 | $70,000 | $125,500 |
| 2014 | -- | $195,500 | $70,000 | $125,500 |
Source: Public Records
Map
Nearby Homes
- 404 N Franklin St
- 11490 Tilia Ln
- 0 N Duey Unit VAFQ2016348
- 0 N Duey Unit VAFQ2018412
- 0 Davis Rd Unit VAFQ2017056
- 0 Catlett Rd Unit VAFQ2019302
- 7058 Helm Dr
- 12629 Tin Pot Run Ln
- 2211 Sedgwick Dr
- 202 Wankoma Dr
- 7645 Wankoma Dr
- 0 Piney Ln Unit VAFQ2018214
- 0 Piney Ridge Rd
- 12406-B Strodes Mill Rd
- 12406 Strodes Mill Rd
- 6835 Brianwood Ct
- 5017 Gray Fox Dr
- Lapis Plan at Foxhaven - Seasons
- Coronado Plan at Foxhaven
- Hemingway Plan at Foxhaven
- 11657 Flag Rock Dr
- 11650 James Madison St
- 11658 James Madison St
- 11662 Flag Rock Dr
- 11661 Flag Rock Dr
- 11668 Flag Rock Dr
- 11665 Flag Rock Dr
- 11668 James Madison St
- 11672 Flag Rock Dr
- 11673 Flag Rock Dr
- 11676 James Madison St
- 11676 James Madison St
- 11678 Flag Rock Dr
- 11675 Flag Rock Dr
- 11615 James Madison St
- 11704 Fort Lee Dr
- 11706 Fort Lee Dr
- 11708 Fort Lee Dr
- 11682 Flag Rock Dr
- 11710 Fort Lee Dr