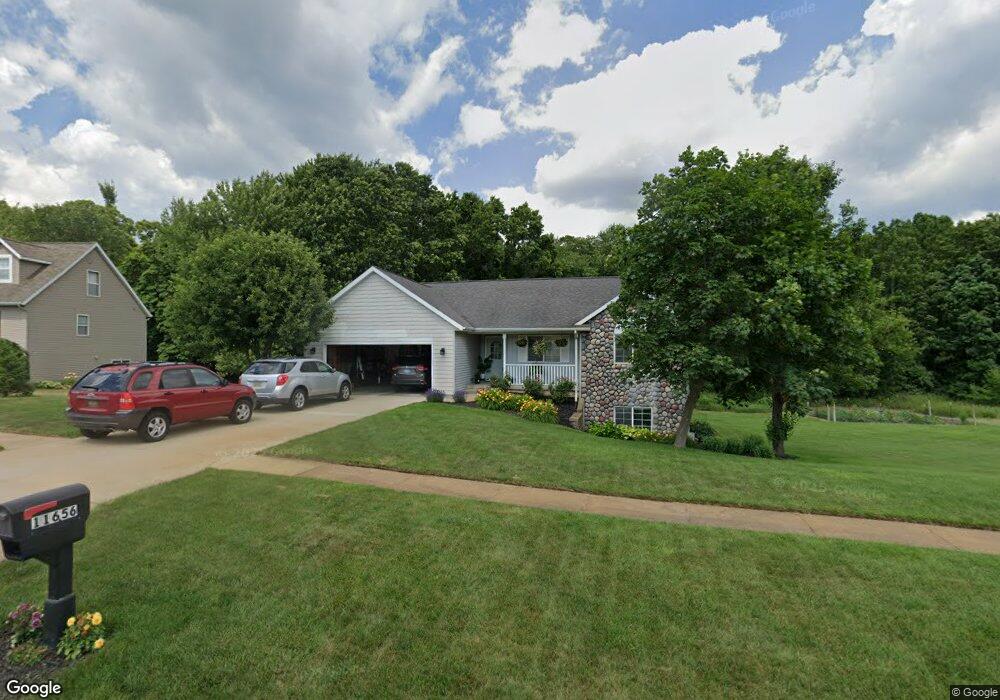
11656 Crystal Ridge Dr NE Unit 72 Sparta, MI 49345
Estimated Value: $412,000 - $452,000
3
Beds
3
Baths
1,330
Sq Ft
$327/Sq Ft
Est. Value
About This Home
This home is located at 11656 Crystal Ridge Dr NE Unit 72, Sparta, MI 49345 and is currently estimated at $434,528, approximately $326 per square foot. 11656 Crystal Ridge Dr NE Unit 72 is a home located in Kent County with nearby schools including Cedar Trails Elementary School, Red Hawk Intermediate School, and Beach Elementary School.
Ownership History
Date
Name
Owned For
Owner Type
Purchase Details
Closed on
May 13, 2016
Sold by
Malon Steve C and Malon Jolie K
Bought by
Malon Steve C
Current Estimated Value
Purchase Details
Closed on
Apr 1, 2016
Sold by
Malon Steve C and Malon Jolie K
Bought by
Malon Steve C
Purchase Details
Closed on
Oct 13, 2005
Sold by
Sable Developing Inc
Bought by
Malon Steve C and Malon Jolie K
Home Financials for this Owner
Home Financials are based on the most recent Mortgage that was taken out on this home.
Original Mortgage
$150,040
Interest Rate
6.17%
Mortgage Type
Fannie Mae Freddie Mac
Create a Home Valuation Report for This Property
The Home Valuation Report is an in-depth analysis detailing your home's value as well as a comparison with similar homes in the area
Home Values in the Area
Average Home Value in this Area
Purchase History
| Date | Buyer | Sale Price | Title Company |
|---|---|---|---|
| Malon Steve C | -- | None Available | |
| Malon Steve C | -- | None Available | |
| Malon Steve C | $187,550 | -- |
Source: Public Records
Mortgage History
| Date | Status | Borrower | Loan Amount |
|---|---|---|---|
| Previous Owner | Malon Steve C | $150,040 |
Source: Public Records
Tax History Compared to Growth
Tax History
| Year | Tax Paid | Tax Assessment Tax Assessment Total Assessment is a certain percentage of the fair market value that is determined by local assessors to be the total taxable value of land and additions on the property. | Land | Improvement |
|---|---|---|---|---|
| 2025 | $2,465 | $178,100 | $0 | $0 |
| 2024 | $2,465 | $163,500 | $0 | $0 |
| 2023 | $2,804 | $156,900 | $0 | $0 |
| 2022 | $2,692 | $133,400 | $0 | $0 |
| 2021 | $2,709 | $131,800 | $0 | $0 |
| 2020 | $2,251 | $126,400 | $0 | $0 |
| 2019 | $2,648 | $122,500 | $0 | $0 |
| 2018 | $2,591 | $105,500 | $0 | $0 |
| 2017 | $2,522 | $97,300 | $0 | $0 |
| 2016 | $2,432 | $93,300 | $0 | $0 |
| 2015 | -- | $93,300 | $0 | $0 |
| 2013 | -- | $81,700 | $0 | $0 |
Source: Public Records
Map
Nearby Homes
- 11775 Crystal Ridge Dr NE Unit 10
- 2833 14 Mile Rd NE
- 2821 14 Mile Rd NE
- 3549 Golden Ridge NE
- 11510 Algoma Ave NE
- 2520 Rosa Casa NE
- V/L Par 1 Algoma Ave
- 12524 Hoskins Ave NE
- 12056 Algoma Ave NE
- 3498 Braeburn Orchard Dr NE
- 10550 Wolven Ave NE
- 4233 Ives Farm Ln NE Unit 45
- 10525 Edgerton Ave NE
- 10550 Algoma Ave NE
- 4530 Summit Forest Dr NE Unit 14
- 10720 Summit Ave NE
- 10429 Summit Ave NE
- 11975 Northland Dr
- 11975 Northland Dr Unit M1 Modular
- 11975 Northland Dr Unit M7 Modular
- 11642 Crystal Ridge Dr NE Unit 73
- 11670 Crystal Ridge Dr NE Unit 71
- 11647 Crystal Ridge Dr NE Unit 4
- 11688 Crystal Ridge Dr NE Unit 70
- 11630 Crystal Ridge Dr NE Unit 74
- 11663 Crystal Ridge Dr NE Unit 5
- 11637 Crystal Ridge Dr NE
- 11700 Crystal Ridge Dr NE Unit 69
- 11711 Crystal Ridge Dr NE Unit 6
- 11618 Crystal Ridge Dr NE Unit 75
- 11623 Crystal Ridge Dr NE Unit 2
- 11623 Crystal Ridge Dr NE Unit 75
- 11701 Hoskins Ave
- 11735 Hoskins Ave
- 11697 Hoskins Ave
- 11718 Echo Ridge Dr NE Unit 68
- 11743 Crystal Ridge Dr NE Unit 7
- 11690 Hoskins Ave
- 11609 Crystal Ridge Dr NE Unit 1
- 11740 Crystal Ridge Dr NE Unit 62