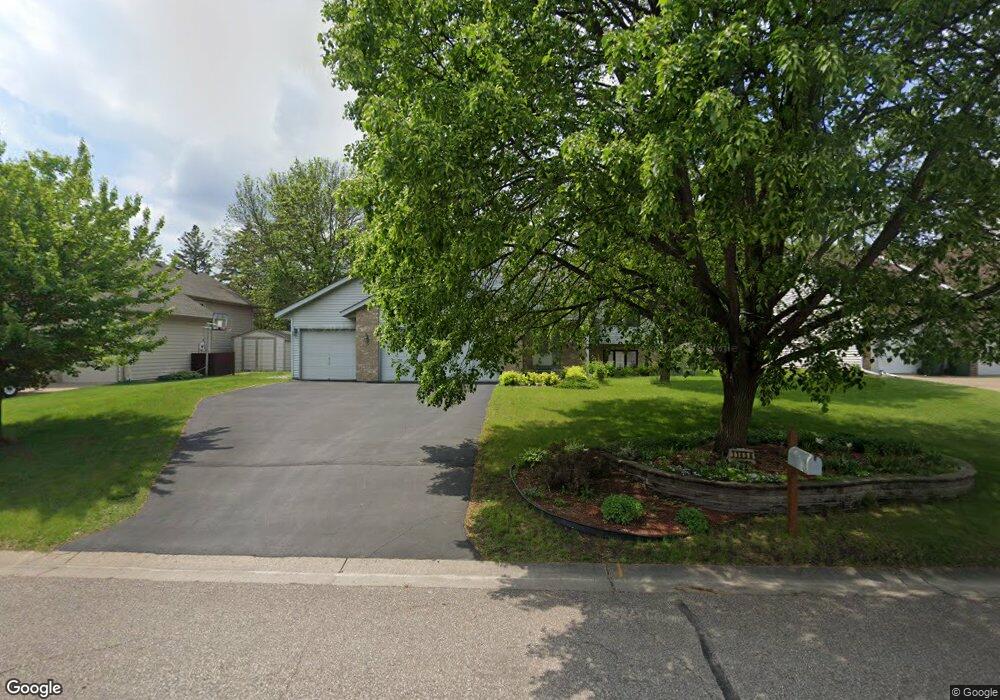
11656 Van Buren Ct NE Minneapolis, MN 55434
Estimated Value: $381,000 - $392,414
3
Beds
2
Baths
1,936
Sq Ft
$199/Sq Ft
Est. Value
About This Home
This home is located at 11656 Van Buren Ct NE, Minneapolis, MN 55434 and is currently estimated at $385,854, approximately $199 per square foot. 11656 Van Buren Ct NE is a home located in Anoka County with nearby schools including Jefferson Elementary School, Northdale Middle School, and Blaine Senior High School.
Ownership History
Date
Name
Owned For
Owner Type
Purchase Details
Closed on
May 28, 2015
Sold by
Fretty Joseph Joseph
Bought by
Cheruvathoor Steve Steve
Current Estimated Value
Home Financials for this Owner
Home Financials are based on the most recent Mortgage that was taken out on this home.
Original Mortgage
$222,000
Outstanding Balance
$172,678
Interest Rate
3.87%
Estimated Equity
$213,176
Create a Home Valuation Report for This Property
The Home Valuation Report is an in-depth analysis detailing your home's value as well as a comparison with similar homes in the area
Home Values in the Area
Average Home Value in this Area
Purchase History
| Date | Buyer | Sale Price | Title Company |
|---|---|---|---|
| Cheruvathoor Steve Steve | $222,000 | -- |
Source: Public Records
Mortgage History
| Date | Status | Borrower | Loan Amount |
|---|---|---|---|
| Open | Cheruvathoor Steve Steve | $222,000 |
Source: Public Records
Tax History Compared to Growth
Tax History
| Year | Tax Paid | Tax Assessment Tax Assessment Total Assessment is a certain percentage of the fair market value that is determined by local assessors to be the total taxable value of land and additions on the property. | Land | Improvement |
|---|---|---|---|---|
| 2025 | $3,633 | $362,300 | $110,000 | $252,300 |
| 2024 | $3,633 | $350,300 | $108,200 | $242,100 |
| 2023 | $3,320 | $352,300 | $103,000 | $249,300 |
| 2022 | $3,056 | $349,900 | $90,000 | $259,900 |
| 2021 | $2,969 | $288,400 | $75,000 | $213,400 |
| 2020 | $2,890 | $274,700 | $75,000 | $199,700 |
| 2019 | $2,715 | $258,700 | $67,000 | $191,700 |
| 2018 | $2,646 | $239,300 | $0 | $0 |
| 2017 | $2,360 | $228,600 | $0 | $0 |
| 2016 | $2,426 | $206,200 | $0 | $0 |
| 2015 | -- | $206,200 | $64,700 | $141,500 |
| 2014 | -- | $176,500 | $52,000 | $124,500 |
Source: Public Records
Map
Nearby Homes
- 11676 Able St NE
- XXX Pierce Ct NE
- 11501 Quincy St NE
- 11737 Able St NE
- 11500 Monroe St NE
- 11683 Polk St NE
- 11741 Fillmore St NE
- 866 113th Ln NE
- 1000 Oak Ridge Point NE
- 961 113th Ave NE
- 11429 Pierce St NE
- 12024 Oak Park Blvd NE
- 11365 Pierce St NE
- 157 Oak Park Dr NE
- 124 116th Ave NE Unit 511
- 123 115th Ln NE Unit 475
- 117 116th Ave NE Unit 420
- 11419 6th Place NE Unit 249
- 12057 Jefferson St NE
- 11407 6th Place NE Unit 246
- 11642 Van Buren Ct NE
- 11670 Van Buren Ct NE
- 11658 Quincy St NE
- 11657 Van Buren Ct NE
- 11684 Van Buren Ct NE
- 11643 Van Buren Ct NE
- 11671 Van Buren Ct NE
- 11666 Quincy St NE
- 11689 Quincy St NE
- 11685 Van Buren Ct NE
- 11698 Van Buren Ct NE
- 11674 Quincy St NE
- 11697 Quincy St NE
- 11697 Van Buren Ct NE
- 11682 Quincy St NE
- 11650 Able St NE
- 11648 Able St NE
- 11632 Able St NE
- 11690 Quincy St NE
- 11616 Able St NE