11657 130th St Gibson, IA 50104
Estimated Value: $254,140
4
Beds
1
Bath
2,672
Sq Ft
$95/Sq Ft
Est. Value
About This Home
This home is located at 11657 130th St, Gibson, IA 50104 and is currently estimated at $254,140, approximately $95 per square foot. 11657 130th St is a home located in Keokuk County with nearby schools including Tri-County Elementary School and Tri-County High School.
Ownership History
Date
Name
Owned For
Owner Type
Purchase Details
Closed on
Apr 29, 2025
Sold by
Steinke Mark and Steinke Alessandra
Bought by
Steinke Spencer L and Steinke Madison E
Current Estimated Value
Home Financials for this Owner
Home Financials are based on the most recent Mortgage that was taken out on this home.
Original Mortgage
$175,000
Outstanding Balance
$174,296
Interest Rate
6.64%
Mortgage Type
Credit Line Revolving
Estimated Equity
$76,810
Purchase Details
Closed on
Nov 26, 2024
Sold by
Steinke Gloria I
Bought by
Steinke Mark
Create a Home Valuation Report for This Property
The Home Valuation Report is an in-depth analysis detailing your home's value as well as a comparison with similar homes in the area
Home Values in the Area
Average Home Value in this Area
Purchase History
| Date | Buyer | Sale Price | Title Company |
|---|---|---|---|
| Steinke Spencer L | $180,000 | None Listed On Document | |
| Steinke Mark | $210,000 | None Listed On Document |
Source: Public Records
Mortgage History
| Date | Status | Borrower | Loan Amount |
|---|---|---|---|
| Open | Steinke Spencer L | $175,000 |
Source: Public Records
Tax History Compared to Growth
Tax History
| Year | Tax Paid | Tax Assessment Tax Assessment Total Assessment is a certain percentage of the fair market value that is determined by local assessors to be the total taxable value of land and additions on the property. | Land | Improvement |
|---|---|---|---|---|
| 2024 | $1,966 | $173,979 | $5,419 | $168,560 |
| 2023 | $1,734 | $173,979 | $5,419 | $168,560 |
| 2022 | $1,368 | $124,562 | $4,152 | $120,410 |
| 2021 | $1,368 | $101,003 | $4,653 | $96,350 |
| 2020 | $1,324 | $94,226 | $4,416 | $89,810 |
| 2019 | $1,112 | $85,270 | $0 | $0 |
| 2018 | $1,068 | $79,527 | $0 | $0 |
| 2017 | $1,068 | $77,742 | $0 | $0 |
| 2016 | $1,050 | $77,742 | $0 | $0 |
| 2015 | $1,050 | $81,583 | $0 | $0 |
| 2014 | $1,112 | $81,583 | $0 | $0 |
Source: Public Records
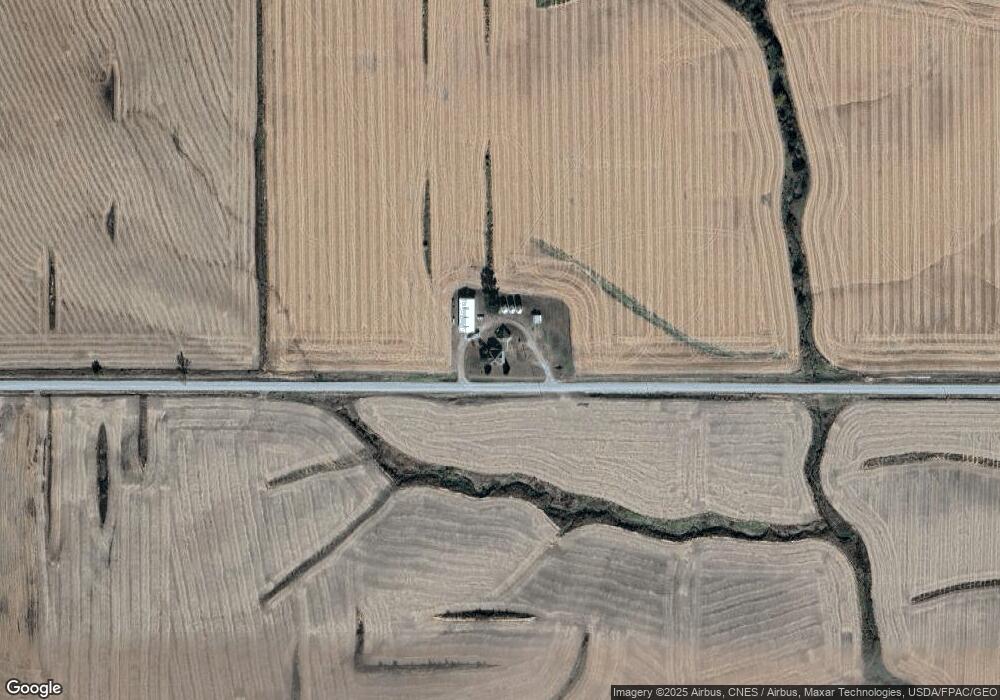
Map
Nearby Homes