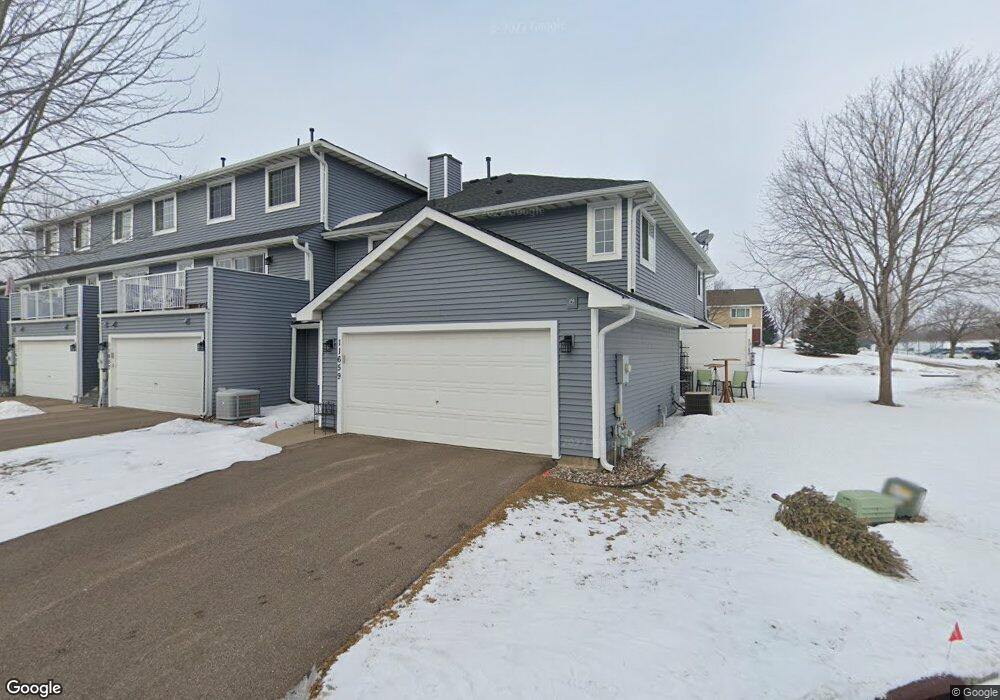
11659 Millpond Ave Burnsville, MN 55337
Estimated Value: $229,762 - $242,000
2
Beds
2
Baths
1,312
Sq Ft
$180/Sq Ft
Est. Value
About This Home
This home is located at 11659 Millpond Ave, Burnsville, MN 55337 and is currently estimated at $235,691, approximately $179 per square foot. 11659 Millpond Ave is a home located in Dakota County with nearby schools including Burnsville High School, Gateway STEM Academy, and Sunrise International Montessori School.
Ownership History
Date
Name
Owned For
Owner Type
Purchase Details
Closed on
Jul 16, 2025
Sold by
State Of Minnesota
Bought by
City Of Burnsville
Current Estimated Value
Purchase Details
Closed on
Sep 27, 2016
Sold by
Wang Huaping and Liu Wei
Bought by
Cascade Home Llc
Purchase Details
Closed on
Dec 29, 2015
Sold by
Us Bank National Association
Bought by
Liu Wei and Wang Huaping
Purchase Details
Closed on
Mar 6, 2015
Sold by
Giles Pamela J
Bought by
Us Bank National Association
Purchase Details
Closed on
Mar 31, 2006
Sold by
Utz Daniel L and Utz Rebecca T
Bought by
Giles Pamela J
Purchase Details
Closed on
Dec 23, 2002
Sold by
Beumer Danielle M
Bought by
Utz Daniel L
Purchase Details
Closed on
Apr 23, 1999
Sold by
Finke Development & Investment Group
Bought by
Delta Development Inc
Create a Home Valuation Report for This Property
The Home Valuation Report is an in-depth analysis detailing your home's value as well as a comparison with similar homes in the area
Home Values in the Area
Average Home Value in this Area
Purchase History
| Date | Buyer | Sale Price | Title Company |
|---|---|---|---|
| City Of Burnsville | -- | None Listed On Document | |
| Cascade Home Llc | -- | None Available | |
| Liu Wei | $115,500 | Home Title Inc | |
| Us Bank National Association | $153,537 | None Available | |
| Giles Pamela J | $179,900 | -- | |
| Utz Daniel L | $159,900 | -- | |
| Delta Development Inc | $5,000 | -- | |
| Beumer Danielle M | $100,925 | -- |
Source: Public Records
Tax History Compared to Growth
Tax History
| Year | Tax Paid | Tax Assessment Tax Assessment Total Assessment is a certain percentage of the fair market value that is determined by local assessors to be the total taxable value of land and additions on the property. | Land | Improvement |
|---|---|---|---|---|
| 2024 | $2,278 | $200,900 | $40,700 | $160,200 |
| 2023 | $2,128 | $216,400 | $40,800 | $175,600 |
| 2022 | $1,992 | $199,000 | $40,700 | $158,300 |
| 2021 | $1,924 | $185,000 | $35,400 | $149,600 |
| 2020 | $1,818 | $169,100 | $33,700 | $135,400 |
| 2019 | $1,823 | $153,900 | $32,100 | $121,800 |
| 2018 | $1,718 | $146,600 | $29,700 | $116,900 |
| 2017 | $1,677 | $134,000 | $27,500 | $106,500 |
| 2016 | $1,376 | $128,200 | $26,200 | $102,000 |
| 2015 | $1,215 | $96,176 | $19,958 | $76,218 |
| 2014 | -- | $87,783 | $18,291 | $69,492 |
| 2013 | -- | $77,210 | $15,589 | $61,621 |
Source: Public Records
Map
Nearby Homes
- 2200 Horizon Rd
- 11900 Highland View Cir
- 1853 Riverwood Dr Unit 4
- 1800 Riverwood Dr Unit 110
- 1800 Riverwood Dr Unit 323
- 2329 Explorer Ct
- 3017 Mcleod St
- 11311 W River Hills Dr
- 11921 Baypoint Dr
- 2001 Woods Ln
- 11902 River Hills Cir
- 1601 Raleigh Dr
- 1609 Riverwood Dr
- 11036 27th Ave S
- 11459 Galtier Dr
- 11115 Carver Ct
- 11017 27th Ave S
- 3309 Red Oak Cir N
- 2005 E 122nd St Unit A7
- 2005 E 122nd St Unit A14
- 2317 E 117th St Unit 41
- 2313 E 117th St Unit 40
- 2309 E 117th St
- 2309 E 117th St Unit 39
- 2305 E 117th St
- 2313 2313 117th-Street-e
- 2301 E 117th St Unit 37
- 11653 Millpond Ave
- 11655 Millpond Ave
- 11661 Millpond Ave Unit 47
- 11663 Millpond Ave
- 11665 Millpond Ave
- 11665 Millpond Ave Unit 49
- 2413 E 117th St
- 2413 E 117th St Unit 32
- 2409 E 117th St
- 11667 Millpond Ave Unit 50
- 2405 E 117th St Unit 30
- 11675 Millpond Ave Unit 51
- 11675 Millpond Ave Unit 5