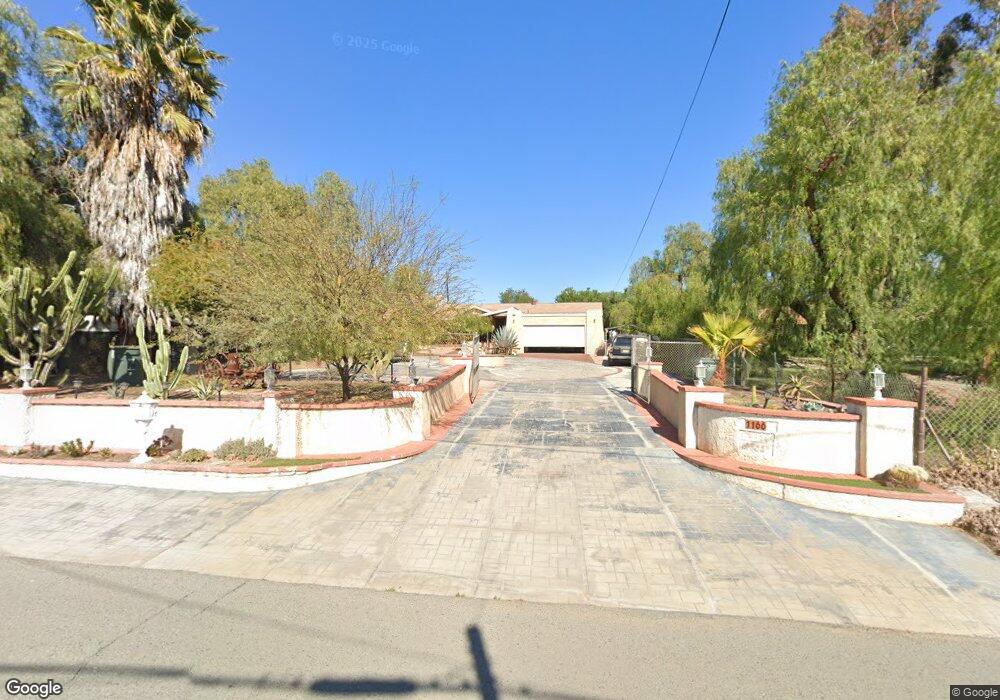
1166 11th St Ramona, CA 92065
Estimated Value: $609,000 - $675,000
3
Beds
2
Baths
1,172
Sq Ft
$557/Sq Ft
Est. Value
About This Home
This home is located at 1166 11th St, Ramona, CA 92065 and is currently estimated at $652,308, approximately $556 per square foot. 1166 11th St is a home located in San Diego County with nearby schools including Ramona Elementary School, Olive Peirce Middle School, and Ramona High School.
Ownership History
Date
Name
Owned For
Owner Type
Purchase Details
Closed on
May 23, 2016
Sold by
Torres Michael and Torres Evelia
Bought by
Gonzalez Ramiro and Gonzalez Leticia
Current Estimated Value
Home Financials for this Owner
Home Financials are based on the most recent Mortgage that was taken out on this home.
Original Mortgage
$233,000
Outstanding Balance
$185,484
Interest Rate
3.66%
Mortgage Type
New Conventional
Estimated Equity
$466,824
Purchase Details
Closed on
Jun 30, 2010
Sold by
Cal Western Reconveyance Corporation
Bought by
Torres Michael
Purchase Details
Closed on
Feb 22, 2010
Sold by
Torres Michael
Bought by
Wells Fargo Bank Na
Purchase Details
Closed on
Jun 4, 2007
Sold by
Torres Michael
Bought by
Torres Michael and Torres Evelia
Purchase Details
Closed on
Jul 20, 2005
Sold by
Torres Evelia
Bought by
Torres Michael
Home Financials for this Owner
Home Financials are based on the most recent Mortgage that was taken out on this home.
Original Mortgage
$363,750
Interest Rate
5.56%
Mortgage Type
New Conventional
Purchase Details
Closed on
Nov 5, 2004
Sold by
Torres Michael
Bought by
Torres Michael and Torres Evelia
Home Financials for this Owner
Home Financials are based on the most recent Mortgage that was taken out on this home.
Original Mortgage
$340,000
Interest Rate
5.7%
Mortgage Type
New Conventional
Purchase Details
Closed on
Jan 29, 2000
Sold by
Torres Michael and Torres Evelia
Bought by
Torres Michael and Torres Evelia
Purchase Details
Closed on
Jul 23, 1999
Sold by
Vanpatten Karen
Bought by
Torres Michael and Torres Evelia
Home Financials for this Owner
Home Financials are based on the most recent Mortgage that was taken out on this home.
Original Mortgage
$178,528
Interest Rate
7.56%
Mortgage Type
FHA
Purchase Details
Closed on
Sep 22, 1994
Sold by
Transamerica Financial Services
Bought by
Taylor Roger B and Taylor Deborah D
Home Financials for this Owner
Home Financials are based on the most recent Mortgage that was taken out on this home.
Original Mortgage
$118,250
Interest Rate
8.7%
Purchase Details
Closed on
Jul 28, 1994
Sold by
Mitchell George P and Mitchell Dixie L
Bought by
Transamerica Financial Services
Home Financials for this Owner
Home Financials are based on the most recent Mortgage that was taken out on this home.
Original Mortgage
$118,250
Interest Rate
8.7%
Purchase Details
Closed on
Jun 28, 1985
Create a Home Valuation Report for This Property
The Home Valuation Report is an in-depth analysis detailing your home's value as well as a comparison with similar homes in the area
Home Values in the Area
Average Home Value in this Area
Purchase History
| Date | Buyer | Sale Price | Title Company |
|---|---|---|---|
| Gonzalez Ramiro | $323,000 | First American Title | |
| Torres Michael | -- | None Available | |
| Wells Fargo Bank Na | $215,322 | Accommodation | |
| Torres Michael | -- | United General Title Ins Co | |
| Torres Michael | -- | Fidelity National Title Co | |
| Torres Michael | -- | -- | |
| Torres Michael | -- | Fidelity National Title Co | |
| Torres Michael | -- | Fidelity Title | |
| Torres Michael | $180,000 | Fidelity National Title | |
| Vanpatten Karin | $145,000 | Fidelity National Title | |
| Taylor Roger B | $131,500 | Chicago Title Co | |
| Transamerica Financial Services | $82,999 | -- | |
| -- | $70,000 | -- |
Source: Public Records
Mortgage History
| Date | Status | Borrower | Loan Amount |
|---|---|---|---|
| Open | Gonzalez Ramiro | $233,000 | |
| Previous Owner | Torres Michael | $363,750 | |
| Previous Owner | Torres Michael | $340,000 | |
| Previous Owner | Torres Michael | $178,528 | |
| Previous Owner | Taylor Roger B | $118,250 |
Source: Public Records
Tax History
| Year | Tax Paid | Tax Assessment Tax Assessment Total Assessment is a certain percentage of the fair market value that is determined by local assessors to be the total taxable value of land and additions on the property. | Land | Improvement |
|---|---|---|---|---|
| 2025 | $4,298 | $382,361 | $236,756 | $145,605 |
| 2024 | $4,298 | $374,864 | $232,114 | $142,750 |
| 2023 | $3,834 | $367,514 | $227,563 | $139,951 |
| 2022 | $3,964 | $360,308 | $223,101 | $137,207 |
| 2021 | $3,894 | $353,244 | $218,727 | $134,517 |
| 2020 | $3,854 | $349,623 | $216,485 | $133,138 |
| 2019 | $3,834 | $342,769 | $212,241 | $130,528 |
| 2018 | $3,733 | $336,049 | $208,080 | $127,969 |
| 2017 | $3,662 | $329,460 | $204,000 | $125,460 |
| 2016 | $2,658 | $233,688 | $107,032 | $126,656 |
| 2015 | $2,622 | $230,179 | $105,425 | $124,754 |
| 2014 | $2,565 | $225,671 | $103,360 | $122,311 |
Source: Public Records
Map
Nearby Homes
- 19630 Camino Vista Unit 191
- 1121 11th St
- 40 acres Sutherland Dam Rd
- 1212 H St Unit 121
- 1212 H St Unit 21
- 1212 H St Unit 202
- 1212 H St Unit 14
- 1212 H St Unit 95
- 1212 H St Unit 158
- 1212 H St Unit 157
- 1212 H St Unit 120
- 1212 H St Unit 48
- 1212 H St Unit 146
- 1212 H St Unit 38
- 1212 H St Unit 116
- 842 11th St
- 915 9th St
- 1278 San Vicente Rd
- 1340 H St
- 1364 H St
- 1160 11th St
- 000 Dye Rd
- 1172 11th St
- 00 Burma Raod
- 0 Road Unit NDP2208821
- 0 Road Unit NDP2208823
- 0 Chihuia Lot 52 Unit NDP2203861
- 0 Chihuia Lot 53 Unit NDP2203863
- 0 Chihuia Lot 51 Unit NDP2203860
- 0 Chihuia Lot 50 Unit NDP2203859
- 0 Rancho Vista Dr Unit 220016711
- 0 Goose Valley Ln Unit 220016712
- 0 Goose Valley Ln
- 0 Rancho Vista Dr
- 40 2861920900
- 1138 11th St
- 1144 11th St
- 1217 10th St
- 1155 11th St
- 1117 Barger Place
Your Personal Tour Guide
Ask me questions while you tour the home.