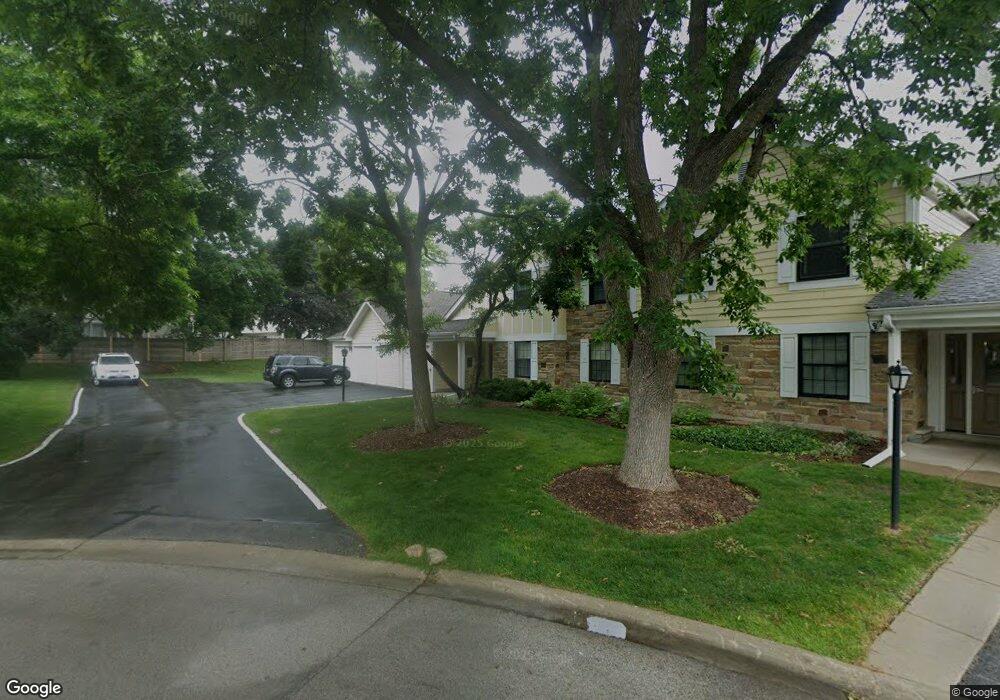
1166 Buckingham Ct Unit 1 Wheeling, IL 60090
Estimated Value: $251,000 - $306,000
2
Beds
--
Bath
1,300
Sq Ft
$213/Sq Ft
Est. Value
About This Home
This home is located at 1166 Buckingham Ct Unit 1, Wheeling, IL 60090 and is currently estimated at $276,809, approximately $212 per square foot. 1166 Buckingham Ct Unit 1 is a home located in Cook County with nearby schools including Joyce Kilmer Elementary School, Cooper Middle School, and Buffalo Grove High School.
Ownership History
Date
Name
Owned For
Owner Type
Purchase Details
Closed on
Oct 12, 2020
Sold by
Weisman Robert and Lila Wesiman Revocable Trust
Bought by
Wicker Patricia
Current Estimated Value
Home Financials for this Owner
Home Financials are based on the most recent Mortgage that was taken out on this home.
Original Mortgage
$171,830
Interest Rate
2.5%
Mortgage Type
FHA
Purchase Details
Closed on
Aug 31, 1998
Sold by
Carroll Timothy W and Hagopian Vivian P
Bought by
Weisman Lila and Lila Weisman Revocable Living Trust
Purchase Details
Closed on
Oct 8, 1993
Sold by
Orlean Randee B and Clute Randee B
Bought by
Carroll Timothy W and Hagopian Vivian P
Home Financials for this Owner
Home Financials are based on the most recent Mortgage that was taken out on this home.
Original Mortgage
$78,400
Interest Rate
7%
Create a Home Valuation Report for This Property
The Home Valuation Report is an in-depth analysis detailing your home's value as well as a comparison with similar homes in the area
Home Values in the Area
Average Home Value in this Area
Purchase History
| Date | Buyer | Sale Price | Title Company |
|---|---|---|---|
| Wicker Patricia | $175,000 | Chicago Title | |
| Weisman Lila | $115,000 | -- | |
| Carroll Timothy W | $65,333 | -- |
Source: Public Records
Mortgage History
| Date | Status | Borrower | Loan Amount |
|---|---|---|---|
| Previous Owner | Wicker Patricia | $171,830 | |
| Previous Owner | Carroll Timothy W | $78,400 |
Source: Public Records
Tax History Compared to Growth
Tax History
| Year | Tax Paid | Tax Assessment Tax Assessment Total Assessment is a certain percentage of the fair market value that is determined by local assessors to be the total taxable value of land and additions on the property. | Land | Improvement |
|---|---|---|---|---|
| 2024 | $5,041 | $18,357 | $3,031 | $15,326 |
| 2023 | $4,774 | $18,357 | $3,031 | $15,326 |
| 2022 | $4,774 | $18,357 | $3,031 | $15,326 |
| 2021 | $3,039 | $11,534 | $505 | $11,029 |
| 2020 | $2,147 | $11,534 | $505 | $11,029 |
| 2019 | $2,207 | $12,907 | $505 | $12,402 |
| 2018 | $0 | $11,440 | $404 | $11,036 |
| 2017 | $1,918 | $11,440 | $404 | $11,036 |
| 2016 | $1,204 | $11,440 | $404 | $11,036 |
| 2015 | $1,351 | $9,136 | $1,717 | $7,419 |
| 2014 | $1,290 | $9,136 | $1,717 | $7,419 |
| 2013 | $883 | $9,136 | $1,717 | $7,419 |
Source: Public Records
Map
Nearby Homes
- 1062 Driftwood Ct Unit 1
- 1317 Wye Ct Unit 79
- 550 Greystone Ln Unit A2
- 584 Fairway View Dr Unit 1I
- 1059 Southbury Ln Unit 1
- 1050 Southbury Ln Unit C2
- 571 Fairway View Dr Unit 2J
- 565 Fairway View Dr Unit 2L
- 1144 Valley Stream Dr
- 220 Osage Ln
- 854 Cambridge Place Unit 128
- 841 Oxford Place Unit 109C
- 493 Mchenry Rd Unit 3B
- 104 Steeple Dr Unit C
- 215 Woodstone Dr
- 738 Brandon Place Unit 104
- 1005 Valley Stream Dr
- 409 Hazelwood Terrace
- 1600 Queens Ct Unit A1
- 434 Dogwood Terrace
- 1166 Buckingham Ct Unit 1
- 1166 Buckingham Ct Unit 1
- 1166 Buckingham Ct Unit 1
- 1166 Buckingham Ct Unit C2
- 1166 Buckingham Ct Unit D2
- 1168 Buckingham Ct Unit 1
- 1168 Buckingham Ct Unit 1
- 1168 Buckingham Ct Unit 1
- 1180 Silverwood Ct Unit A2
- 1180 Silverwood Ct Unit 1
- 1180 Silverwood Ct Unit 1
- 1180 Silverwood Ct Unit A1
- 1180 Silverwood Ct Unit B1
- 1180 Silverwood Ct Unit B2
- 1180 Silverwood Ct
- 1201 Thyne Ct Unit 27
- 1207 Thyne Ct Unit 27
- 1207 Thyne Ct Unit 1207
- 1205 Thyne Ct Unit 27
- 1182 Buckingham Ct Unit 1