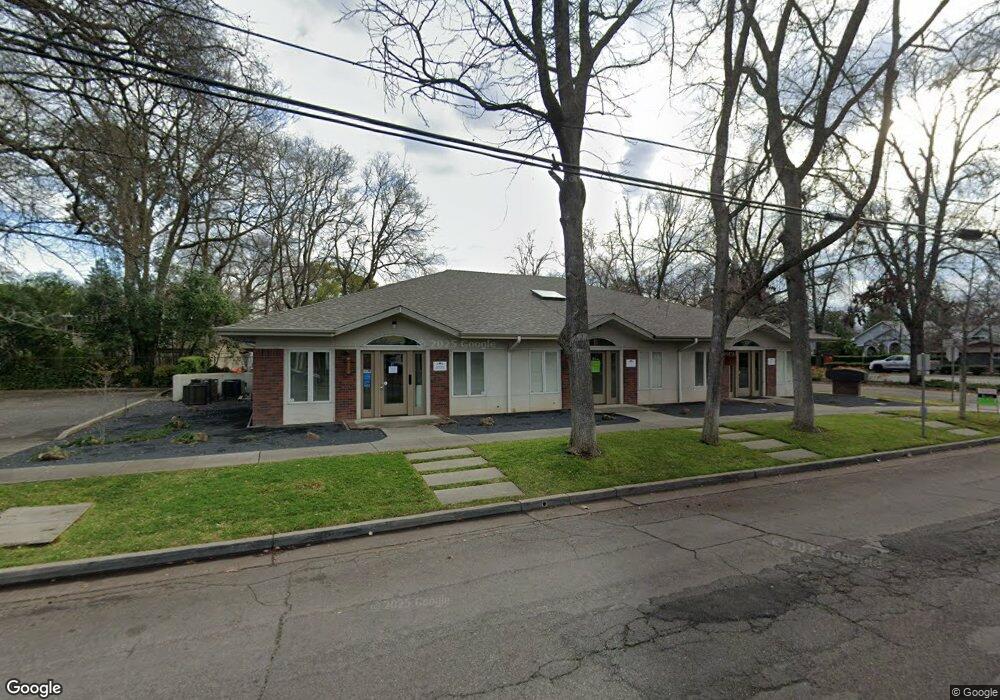
1166 Esplanade Unit Suite 2 Chico, CA 95926
Chico Vecino NeighborhoodEstimated Value: $941,100
--
Bed
--
Bath
4,573
Sq Ft
$206/Sq Ft
Est. Value
About This Home
This home is located at 1166 Esplanade Unit Suite 2, Chico, CA 95926 and is currently estimated at $941,100, approximately $205 per square foot. 1166 Esplanade Unit Suite 2 is a home located in Butte County with nearby schools including Citrus Avenue Elementary School, Chico Junior High School, and Chico High School.
Ownership History
Date
Name
Owned For
Owner Type
Purchase Details
Closed on
Feb 24, 2014
Sold by
Pearce S Nile and S Nile Pearce Living Trust
Bought by
Mfc Investments Lp
Current Estimated Value
Purchase Details
Closed on
Apr 22, 2013
Sold by
Pearce Grover W
Bought by
Pearce Kevin G and Pearce Stacy
Purchase Details
Closed on
Apr 19, 2013
Sold by
Pearce Grover W
Bought by
Pearce Kevin G and Pearce Stacy
Purchase Details
Closed on
Apr 18, 2013
Sold by
Pearce Grover W
Bought by
Pearce Kevin G and Pearce Stacy
Purchase Details
Closed on
Apr 17, 2013
Sold by
Pearce Grover W
Bought by
Pearce Kevin G and Pearce Stacy
Purchase Details
Closed on
Apr 15, 2013
Sold by
Pearce Grover W
Bought by
Pearce Kevin G and Pearce Stacy
Purchase Details
Closed on
Apr 12, 2013
Sold by
Pearce Grover W
Bought by
Pearce Kevin G and Pearce Stacy
Purchase Details
Closed on
Apr 11, 2013
Sold by
Pearce Grover W
Bought by
Pearce Kevin G and Pearce Stacy
Purchase Details
Closed on
Apr 10, 2013
Sold by
Pearce Grover W
Bought by
Pearce Kevin G and Pearce Stacy
Purchase Details
Closed on
Apr 9, 2013
Sold by
Pearce Grover W
Bought by
Pearce Kevin G and Pearce Stacy
Purchase Details
Closed on
Apr 8, 2013
Sold by
Pearce Grover W
Bought by
Pearce Kevin G and Pearce Stacy
Purchase Details
Closed on
Apr 5, 2013
Sold by
Pearce Grover W
Bought by
Pearce Kevin G and Pearce Stacy
Purchase Details
Closed on
Apr 4, 2013
Sold by
Pearce Grover W
Bought by
Pearce Kevin G and Pearce Stacy
Purchase Details
Closed on
Apr 2, 2013
Sold by
Pearce Grover W
Bought by
Pearce Kevin G and Pearce Stacy
Purchase Details
Closed on
Apr 1, 2013
Sold by
Pearce Grover W
Bought by
Pearce Kevin G and Pearce Stacy
Purchase Details
Closed on
Mar 29, 2013
Sold by
Pearce Grover W
Bought by
Pearce Kevin G and Pearce Stacy
Purchase Details
Closed on
Mar 27, 2013
Sold by
Pearce Grover W
Bought by
Pearce Kevin G and Pearce Stacy
Purchase Details
Closed on
Mar 25, 2013
Sold by
Pearce Grover W
Bought by
Pearce Kevin G and Pearce Stacy
Purchase Details
Closed on
Mar 16, 2013
Sold by
Pearce Grover W
Bought by
Pearce Kevin G and Pearce Stacy
Purchase Details
Closed on
Mar 8, 2010
Sold by
Pearce S Nile
Bought by
Pearce S Nile and The S Nile Pearce Living Trust
Purchase Details
Closed on
Aug 6, 2003
Sold by
Pearce Grover W
Bought by
Pearce Grover W
Create a Home Valuation Report for This Property
The Home Valuation Report is an in-depth analysis detailing your home's value as well as a comparison with similar homes in the area
Home Values in the Area
Average Home Value in this Area
Purchase History
| Date | Buyer | Sale Price | Title Company |
|---|---|---|---|
| Mfc Investments Lp | $490,000 | Fidelity Natl Title Co Of Ca | |
| Pearce Kevin G | -- | None Available | |
| Pearce Kevin G | -- | None Available | |
| Pearce Kevin G | -- | None Available | |
| Pearce Kevin G | -- | None Available | |
| Pearce Kevin G | -- | None Available | |
| Pearce Kevin G | -- | None Available | |
| Pearce Kevin G | -- | None Available | |
| Pearce Kevin G | -- | None Available | |
| Pearce Kevin G | -- | None Available | |
| Pearce Kevin G | -- | None Available | |
| Pearce Kevin G | -- | None Available | |
| Pearce Kevin G | -- | None Available | |
| Pearce Kevin G | -- | None Available | |
| Pearce Kevin G | -- | None Available | |
| Pearce Kevin G | -- | None Available | |
| Pearce Kevin G | -- | None Available | |
| Pearce Kevin G | -- | None Available | |
| Pearce Grover W | -- | None Available | |
| Pearce Grover W | -- | None Available | |
| Pearce Kevin G | -- | None Available | |
| Pearce S Nile | -- | None Available | |
| Pearce S Nile | -- | None Available | |
| Pearce Grover W | -- | -- |
Source: Public Records
Tax History Compared to Growth
Tax History
| Year | Tax Paid | Tax Assessment Tax Assessment Total Assessment is a certain percentage of the fair market value that is determined by local assessors to be the total taxable value of land and additions on the property. | Land | Improvement |
|---|---|---|---|---|
| 2025 | $6,532 | $600,664 | $183,874 | $416,790 |
| 2024 | $6,532 | $588,887 | $180,269 | $408,618 |
| 2023 | $6,455 | $577,341 | $176,735 | $400,606 |
| 2022 | $6,350 | $566,021 | $173,270 | $392,751 |
| 2021 | $6,231 | $554,923 | $169,873 | $385,050 |
| 2020 | $6,213 | $549,234 | $168,132 | $381,102 |
| 2019 | $6,101 | $538,466 | $164,836 | $373,630 |
| 2018 | $5,989 | $527,908 | $161,604 | $366,304 |
| 2017 | $5,867 | $517,558 | $158,436 | $359,122 |
| 2016 | $5,355 | $507,411 | $155,330 | $352,081 |
| 2015 | $5,355 | $499,790 | $152,997 | $346,793 |
| 2014 | $5,226 | $490,000 | $150,000 | $340,000 |
Source: Public Records
Map
Nearby Homes
- 168 E 1st Ave
- 1050 Esplanade
- 256 E 1st Ave
- 1244 Magnolia Ave Unit 9
- 202 W 2nd Ave
- 234 W 3rd Ave
- 325 W 1st Ave
- 384 E Washington Ave
- 345 W 1st Ave
- 1245 Palm Ave
- 1617 Arcadian Ave
- 1627 Arcadian Ave
- 1709 Arcadian Ave
- 1705 Spruce Ave
- 642 W 1st Ave
- 703 W 2nd Ave
- 1930 Arcadian Ave
- 498 E 8th Ave
- 810 W 1st Ave
- 1420 Sherman Ave Unit 27
- 1166 Esplanade Unit 3
- 1166 Esplanade Unit Suite 3
- 1166 the Esplanade
- 1150 Esplanade
- 170 E 2nd Ave Unit 1
- 170 E 2nd Ave Unit 2
- 158 E 2nd Ave
- 179 E 2nd Ave
- 1218 Esplanade
- 179 1/2 E 2nd Ave
- 1222 Esplanade
- 185 E 2nd Ave
- 176 E 2nd Ave
- 1100 Esplanade
- 184 E 2nd Ave
- 1131 Oleander Ave
- 1115 Oleander Ave
- 199 E 2nd Ave
- 180 E 1st Ave
- 1143 Oleander Ave