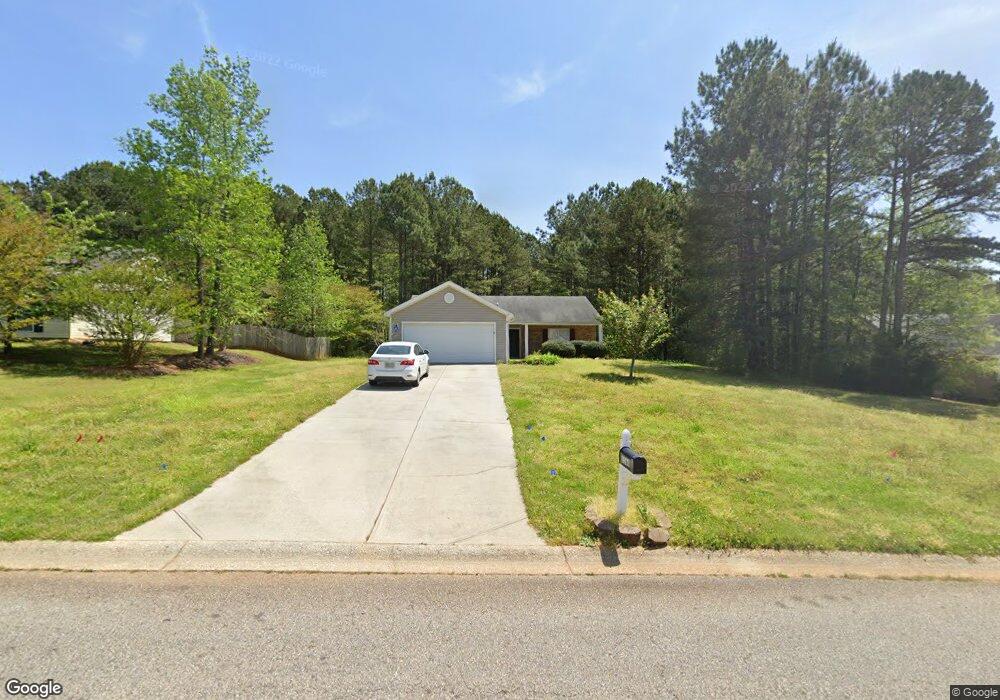
1166 Locust Dr Unit 25D Bethlehem, GA 30620
Estimated Value: $281,000 - $320,000
3
Beds
2
Baths
1,284
Sq Ft
$232/Sq Ft
Est. Value
About This Home
This home is located at 1166 Locust Dr Unit 25D, Bethlehem, GA 30620 and is currently estimated at $298,284, approximately $232 per square foot. 1166 Locust Dr Unit 25D is a home located in Barrow County with nearby schools including Yargo Elementary School, Haymon-Morris Middle School, and Apalachee High School.
Ownership History
Date
Name
Owned For
Owner Type
Purchase Details
Closed on
Oct 28, 2021
Sold by
Equity Trust Company Custodian Fbo
Bought by
Fkh Sfr Propco H Lp
Current Estimated Value
Purchase Details
Closed on
Jan 19, 2017
Sold by
Knight Jimmy Lee
Bought by
Equity Trust Co Custodian Fbo and Mahoney Philip Ira
Purchase Details
Closed on
Apr 4, 2013
Sold by
Secretary Of Housing And U
Bought by
Knight Jimmy Lee
Home Financials for this Owner
Home Financials are based on the most recent Mortgage that was taken out on this home.
Original Mortgage
$88,420
Interest Rate
5.5%
Mortgage Type
FHA
Purchase Details
Closed on
Jun 5, 2012
Sold by
Bank Of America Na
Bought by
Secretary Of Housing And Urban and Conn C O Michaelson
Purchase Details
Closed on
Sep 15, 2003
Sold by
Southfork Hms Inc
Bought by
Roper Earl E
Home Financials for this Owner
Home Financials are based on the most recent Mortgage that was taken out on this home.
Original Mortgage
$116,471
Interest Rate
6.28%
Mortgage Type
FHA
Purchase Details
Closed on
Aug 19, 2003
Sold by
Parkview Development Inc
Bought by
Southfork Homes Inc
Home Financials for this Owner
Home Financials are based on the most recent Mortgage that was taken out on this home.
Original Mortgage
$116,471
Interest Rate
6.28%
Mortgage Type
FHA
Purchase Details
Closed on
May 2, 2000
Bought by
Parkview Development Inc
Create a Home Valuation Report for This Property
The Home Valuation Report is an in-depth analysis detailing your home's value as well as a comparison with similar homes in the area
Home Values in the Area
Average Home Value in this Area
Purchase History
| Date | Buyer | Sale Price | Title Company |
|---|---|---|---|
| Fkh Sfr Propco H Lp | $254,000 | -- | |
| Equity Trust Co Custodian Fbo | $125,000 | -- | |
| Knight Jimmy Lee | $87,000 | -- | |
| Secretary Of Housing And Urban | $110,741 | -- | |
| Bank Of America Na | $110,741 | -- | |
| Roper Earl E | $118,400 | -- | |
| Southfork Homes Inc | $280,000 | -- | |
| Parkview Development Inc | -- | -- |
Source: Public Records
Mortgage History
| Date | Status | Borrower | Loan Amount |
|---|---|---|---|
| Previous Owner | Knight Jimmy Lee | $88,420 | |
| Previous Owner | Roper Earl E | $116,471 |
Source: Public Records
Tax History Compared to Growth
Tax History
| Year | Tax Paid | Tax Assessment Tax Assessment Total Assessment is a certain percentage of the fair market value that is determined by local assessors to be the total taxable value of land and additions on the property. | Land | Improvement |
|---|---|---|---|---|
| 2024 | $2,445 | $96,068 | $25,200 | $70,868 |
| 2023 | $2,453 | $96,668 | $25,200 | $71,468 |
| 2022 | $2,043 | $68,701 | $20,000 | $48,701 |
| 2021 | $1,893 | $59,891 | $16,000 | $43,891 |
| 2020 | $1,705 | $53,477 | $16,000 | $37,477 |
| 2019 | $1,734 | $53,477 | $16,000 | $37,477 |
| 2018 | $1,608 | $50,677 | $13,200 | $37,477 |
| 2017 | $1,318 | $45,279 | $13,200 | $32,079 |
| 2016 | $1,333 | $41,426 | $13,200 | $28,226 |
| 2015 | $1,348 | $41,736 | $13,200 | $28,536 |
| 2014 | $1,191 | $35,314 | $6,468 | $28,846 |
| 2013 | -- | $33,914 | $6,468 | $27,446 |
Source: Public Records
Map
Nearby Homes
- 0 Jb Owens Unit 7552902
- 0 Jb Owens Unit 7552891
- 0 Jb Owens Unit LOT 2 - 2.09 ACRES
- 0 Jb Owens Unit LOT 3 - 2.01 ACRES
- 190 Lokeys Ln
- 303 Ron Dr
- 763 Moss Side Dr
- 0 Tanners Bridge Rd Unit 10588144
- 637 Sleeping Meadow Ln
- The Barnes Plan at River Meadows
- The Paisley Plan at River Meadows
- The Rose II Plan at River Meadows
- The Logan Plan at River Meadows
- 209 Angie Way
- 758 Clarence Edwards Rd
- 1071 Covenant Ct
- 286 Meadows Dr
- 1129 Loganville Hwy
- 1111 Otis Dr
- 103 Camp Ct
- 1166 Locust Dr
- 1168 Locust Dr Unit 3
- 1164 Locust Dr Unit 26D
- 1164 Locust Dr Unit 3
- 1170 Locust Dr
- 1162 Locust Dr Unit 3
- 565 Pin Oak Dr
- 563 Pin Oak Dr Unit 6D
- 563 Pin Oak Dr
- 567 Pin Oak Dr
- 561 Pin Oak Dr Unit 3
- 1242 Persimmon Place Dr
- 1160 Locust Dr
- 1160 Locust Dr Unit 3
- 569 Pin Oak Dr
- 1240 Persimmon Place Dr Unit 22D
- 1240 Persimmon Place Dr Unit 3
- 1167 Locust Dr Unit 5C
- 1167 Locust Dr Unit 3
- 1165 Locust Dr Unit 4C