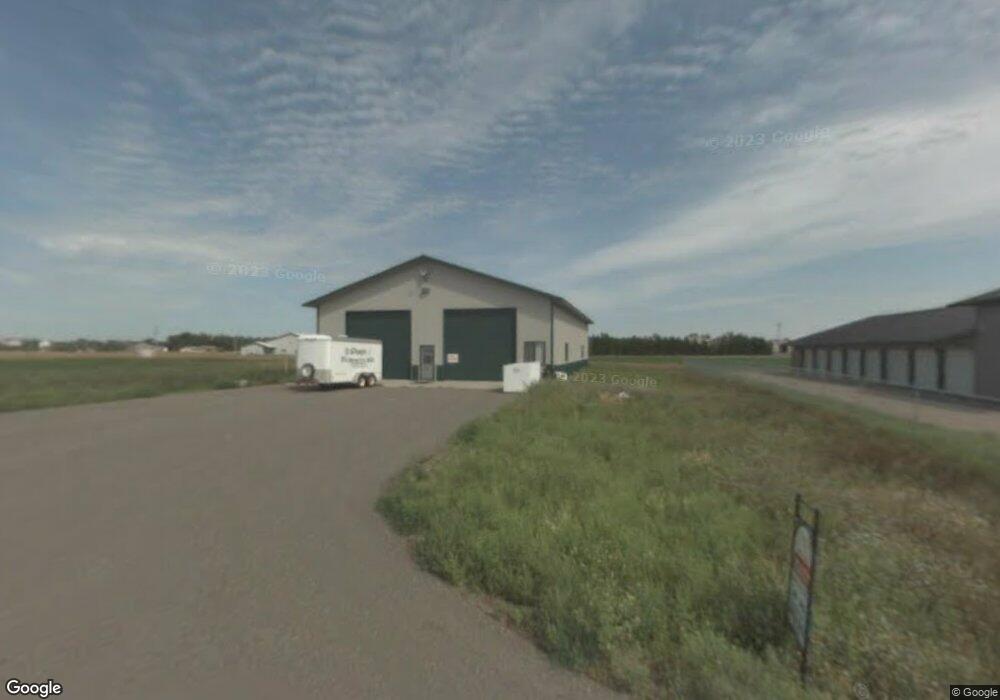
11663 150th Ave Little Falls, MN 56345
Estimated Value: $297,100
--
Bed
--
Bath
3,840
Sq Ft
$77/Sq Ft
Est. Value
About This Home
This home is located at 11663 150th Ave, Little Falls, MN 56345 and is currently estimated at $297,100, approximately $77 per square foot. 11663 150th Ave is a home located in Morrison County with nearby schools including Little Falls Senior High School, Mary of Lourdes Elementary, and Mary of Lourdes School.
Ownership History
Date
Name
Owned For
Owner Type
Purchase Details
Closed on
May 27, 2010
Sold by
Pine Country Bank
Bought by
Zajaczkowski Mark A
Current Estimated Value
Home Financials for this Owner
Home Financials are based on the most recent Mortgage that was taken out on this home.
Original Mortgage
$156,969
Interest Rate
5.12%
Mortgage Type
Seller Take Back
Purchase Details
Closed on
Jan 3, 2007
Sold by
Atkinson Scott and Atkinson Tracie Ann
Bought by
T & M Drong Furniture Llc
Home Financials for this Owner
Home Financials are based on the most recent Mortgage that was taken out on this home.
Original Mortgage
$183,338
Interest Rate
6.24%
Mortgage Type
Future Advance Clause Open End Mortgage
Purchase Details
Closed on
Feb 21, 2006
Sold by
Hilmerso James J and Hilmerson Linda L
Bought by
Hansen Jack E
Purchase Details
Closed on
Feb 13, 2006
Sold by
Hansen Jack E and Kleven Darcie L
Bought by
Atkinson Scott and Atkinson Tracie Ann
Create a Home Valuation Report for This Property
The Home Valuation Report is an in-depth analysis detailing your home's value as well as a comparison with similar homes in the area
Home Values in the Area
Average Home Value in this Area
Purchase History
| Date | Buyer | Sale Price | Title Company |
|---|---|---|---|
| Zajaczkowski Mark A | $170,954 | None Available | |
| T & M Drong Furniture Llc | $174,000 | None Available | |
| Hansen Jack E | $10,000 | None Available | |
| Atkinson Scott | $152,500 | None Available |
Source: Public Records
Mortgage History
| Date | Status | Borrower | Loan Amount |
|---|---|---|---|
| Closed | Zajaczkowski Mark A | $156,969 | |
| Closed | T & M Drong Furniture Llc | $183,338 |
Source: Public Records
Tax History Compared to Growth
Tax History
| Year | Tax Paid | Tax Assessment Tax Assessment Total Assessment is a certain percentage of the fair market value that is determined by local assessors to be the total taxable value of land and additions on the property. | Land | Improvement |
|---|---|---|---|---|
| 2025 | $2,968 | $217,700 | $69,200 | $148,500 |
| 2024 | $2,982 | $204,700 | $56,200 | $148,500 |
| 2023 | $2,700 | $203,700 | $55,200 | $148,500 |
| 2022 | $3,022 | $178,900 | $55,200 | $123,700 |
| 2021 | $2,976 | $168,600 | $55,200 | $113,400 |
| 2020 | $3,092 | $481,700 | $165,600 | $316,100 |
| 2019 | $2,860 | $164,400 | $55,200 | $109,200 |
| 2018 | $3,220 | $152,900 | $55,200 | $97,700 |
| 2017 | $3,876 | $161,100 | $55,200 | $105,900 |
| 2016 | $3,824 | $0 | $0 | $0 |
| 2014 | $3,810 | $0 | $0 | $0 |
| 2013 | $3,810 | $0 | $0 | $0 |
Source: Public Records
Map
Nearby Homes
- 13058 Haven Rd
- 10961 Harvest Rd
- 10904 Harvest Rd
- xxxx Hillton Rd
- TBD Hillton Rd
- 500 8th Ave SE
- 811 6th St SE
- 57 Cherry Ave
- TBD 143rd St
- 1006 11th St SW
- 1007 12th St SW
- 208 2nd St SE
- 501 3rd St SW
- 312 E Broadway
- 15592 Highway 27
- 1200 3rd Ave NE
- 605 8th St SW
- 310 8th St NE
- TBD 18th St NE
- 402 6th St SW
- xxxx Kendra Ln
- xxx Kendra Ln
- 14753 Iris Rd
- 14796 Iris Rd
- 16XXX Iris Rd
- 14950 Iris Rd
- xxxx 150th Ave
- 15041 Iris Rd
- 11536 Highway 10
- 11536 Highway 10
- 11878 Grouse Dr
- 11514 150th Ave
- 15012 Karen Ln
- 15111 Karen Ln
- 15034 Karen Ln
- 15034 Karen Ln
- 15011 Gordon Cir
- 15123 Karen Ln
- TBD 88th St
- 15015 Gordon Cir