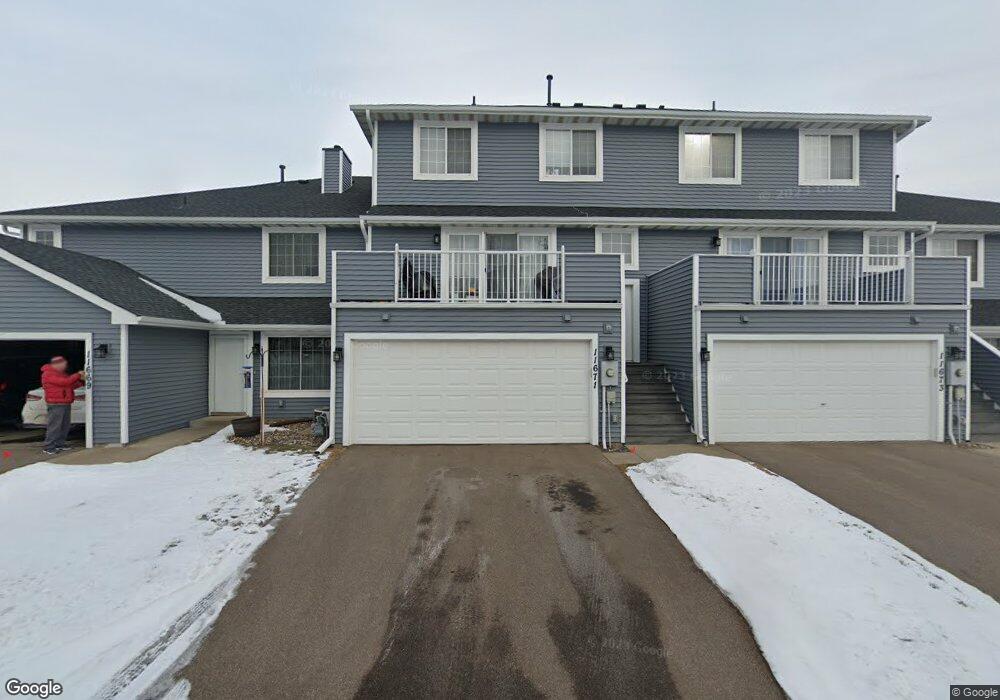
11663 Millpond Ave Burnsville, MN 55337
Estimated Value: $241,598 - $250,000
2
Beds
2
Baths
1,200
Sq Ft
$204/Sq Ft
Est. Value
About This Home
This home is located at 11663 Millpond Ave, Burnsville, MN 55337 and is currently estimated at $245,150, approximately $204 per square foot. 11663 Millpond Ave is a home located in Dakota County with nearby schools including Burnsville High School, Gateway STEM Academy, and Sunrise International Montessori School.
Ownership History
Date
Name
Owned For
Owner Type
Purchase Details
Closed on
Jul 16, 2025
Sold by
State Of Minnesota
Bought by
City Of Burnsville
Current Estimated Value
Purchase Details
Closed on
Aug 14, 2008
Sold by
Chamorro Jose and Chamorro Marni K
Bought by
Khaskilevich Roman and Lukashevich Andrey
Home Financials for this Owner
Home Financials are based on the most recent Mortgage that was taken out on this home.
Original Mortgage
$157,753
Interest Rate
6.5%
Mortgage Type
FHA
Purchase Details
Closed on
Aug 2, 2004
Sold by
Not Provided
Bought by
Foltz Marni K
Purchase Details
Closed on
Oct 19, 2000
Sold by
Aufmuth Alois and Augmuth Renee
Bought by
Niemioja Nikko J
Purchase Details
Closed on
Oct 6, 1998
Sold by
Minor Cory J and Minor Kate E
Bought by
Autmuth Alois and Pearson Renee
Purchase Details
Closed on
Sep 30, 1997
Sold by
Delta Development Inc
Bought by
Miner Cory J
Create a Home Valuation Report for This Property
The Home Valuation Report is an in-depth analysis detailing your home's value as well as a comparison with similar homes in the area
Home Values in the Area
Average Home Value in this Area
Purchase History
| Date | Buyer | Sale Price | Title Company |
|---|---|---|---|
| City Of Burnsville | -- | None Listed On Document | |
| Khaskilevich Roman | $159,000 | -- | |
| Foltz Marni K | $170,000 | -- | |
| Niemioja Nikko J | $137,900 | -- | |
| Autmuth Alois | $97,500 | -- | |
| Miner Cory J | $94,565 | -- | |
| Delta Development Inc | $5,000 | -- |
Source: Public Records
Mortgage History
| Date | Status | Borrower | Loan Amount |
|---|---|---|---|
| Previous Owner | Khaskilevich Roman | $157,753 |
Source: Public Records
Tax History Compared to Growth
Tax History
| Year | Tax Paid | Tax Assessment Tax Assessment Total Assessment is a certain percentage of the fair market value that is determined by local assessors to be the total taxable value of land and additions on the property. | Land | Improvement |
|---|---|---|---|---|
| 2024 | $2,264 | $200,900 | $37,000 | $163,900 |
| 2023 | $2,264 | $215,200 | $37,100 | $178,100 |
| 2022 | $2,010 | $198,400 | $37,000 | $161,400 |
| 2021 | $1,960 | $186,600 | $32,200 | $154,400 |
| 2020 | $1,854 | $172,300 | $30,700 | $141,600 |
| 2019 | $1,863 | $157,000 | $29,200 | $127,800 |
| 2018 | $1,774 | $149,800 | $27,000 | $122,800 |
| 2017 | $1,739 | $138,400 | $25,000 | $113,400 |
| 2016 | $1,718 | $133,000 | $23,800 | $109,200 |
| 2015 | $1,264 | $126,000 | $23,100 | $102,900 |
| 2014 | -- | $91,598 | $16,816 | $74,782 |
| 2013 | -- | $81,134 | $14,419 | $66,715 |
Source: Public Records
Map
Nearby Homes
- 2200 Horizon Rd
- 11900 Highland View Cir
- 1853 Riverwood Dr Unit 4
- 1800 Riverwood Dr Unit 110
- 1800 Riverwood Dr Unit 323
- 2329 Explorer Ct
- 3017 Mcleod St
- 11311 W River Hills Dr
- 11921 Baypoint Dr
- 2001 Woods Ln
- 11902 River Hills Cir
- 1601 Raleigh Dr
- 1609 Riverwood Dr
- 11036 27th Ave S
- 11459 Galtier Dr
- 11115 Carver Ct
- 11017 27th Ave S
- 3309 Red Oak Cir N
- 2005 E 122nd St Unit A7
- 2005 E 122nd St Unit A14
- 11661 Millpond Ave Unit 47
- 11665 Millpond Ave
- 11665 Millpond Ave Unit 49
- 11667 Millpond Ave Unit 50
- 2313 2313 117th-Street-e
- 11659 Millpond Ave
- 2317 E 117th St Unit 41
- 2313 E 117th St Unit 40
- 11671 Millpond Ave
- 11671 Millpond Ave Unit 157
- 11675 Millpond Ave Unit 51
- 11675 Millpond Ave Unit 5
- 2309 E 117th St
- 2309 E 117th St Unit 39
- 11653 Millpond Ave
- 2305 E 117th St
- 11655 Millpond Ave
- 11677 Millpond Ave
- 2301 E 117th St Unit 37
- 11707 Millpond Ave