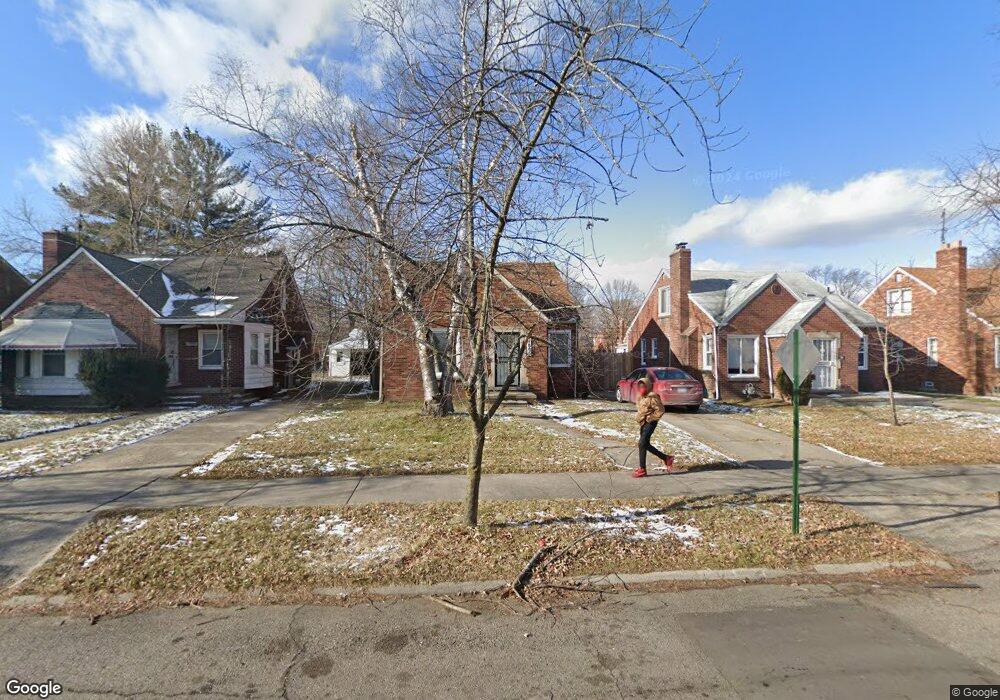
11665 Lansdowne St Detroit, MI 48224
Denby NeighborhoodEstimated Value: $88,000 - $110,000
--
Bed
1
Bath
1,310
Sq Ft
$74/Sq Ft
Est. Value
About This Home
This home is located at 11665 Lansdowne St, Detroit, MI 48224 and is currently estimated at $96,600, approximately $73 per square foot. 11665 Lansdowne St is a home located in Wayne County with nearby schools including Carleton Elementary School, Edward 'Duke' Ellington Conservatory of Music and Art, and Charles L. Spain Elementary-Middle School.
Ownership History
Date
Name
Owned For
Owner Type
Purchase Details
Closed on
May 3, 2015
Sold by
The Detroit Land Bank Authority
Bought by
Farley Deonta
Current Estimated Value
Purchase Details
Closed on
Jan 6, 2015
Sold by
Treasurer Of The Charter County Of Wayne
Bought by
Detroit Land Bank Authority
Purchase Details
Closed on
Nov 29, 2007
Sold by
Dixon Roy and Dixon Evangle
Bought by
Polite Kevin
Purchase Details
Closed on
Sep 26, 2007
Sold by
Dixon Roy and Dixon Carla Bedford
Bought by
Lasalle Bank Midwest Na
Purchase Details
Closed on
Jun 28, 2005
Sold by
Fannie Mae
Bought by
Dixon Roy
Purchase Details
Closed on
Sep 24, 2004
Sold by
Mortgage Electronic Registration Systems
Bought by
Federal National Mortgage Association
Purchase Details
Closed on
Sep 2, 2004
Sold by
Patterson Paul and Patterson Gail
Bought by
Mortgage Electronic Registration Systems and First Equity Funding
Create a Home Valuation Report for This Property
The Home Valuation Report is an in-depth analysis detailing your home's value as well as a comparison with similar homes in the area
Home Values in the Area
Average Home Value in this Area
Purchase History
| Date | Buyer | Sale Price | Title Company |
|---|---|---|---|
| Farley Deonta | $8,100 | None Available | |
| Detroit Land Bank Authority | -- | None Available | |
| Polite Kevin | $115,000 | Multiple | |
| Lasalle Bank Midwest Na | $59,511 | None Available | |
| Dixon Roy | $67,000 | Greco | |
| Federal National Mortgage Association | -- | Parks Title | |
| Mortgage Electronic Registration Systems | $80,639 | -- |
Source: Public Records
Tax History Compared to Growth
Tax History
| Year | Tax Paid | Tax Assessment Tax Assessment Total Assessment is a certain percentage of the fair market value that is determined by local assessors to be the total taxable value of land and additions on the property. | Land | Improvement |
|---|---|---|---|---|
| 2025 | $1,050 | $30,500 | $0 | $0 |
| 2024 | $1,050 | $27,800 | $0 | $0 |
| 2023 | $1,017 | $22,400 | $0 | $0 |
| 2022 | $1,109 | $19,900 | $0 | $0 |
| 2021 | $1,082 | $16,100 | $0 | $0 |
| 2020 | $1,116 | $15,000 | $0 | $0 |
| 2019 | $948 | $13,200 | $0 | $0 |
| 2018 | $906 | $11,700 | $0 | $0 |
| 2017 | $211 | $11,100 | $0 | $0 |
| 2016 | $1,681 | $19,000 | $0 | $0 |
| 2015 | $1,900 | $19,000 | $0 | $0 |
| 2013 | $2,633 | $26,331 | $0 | $0 |
| 2010 | -- | $38,606 | $1,556 | $37,050 |
Source: Public Records
Map
Nearby Homes
- 11583 Whitehill St
- 11320 Wayburn St
- 11845 Laing St
- 11676 Laing St
- 11528 Wayburn St
- 11540 Wayburn St
- 11974 Duchess St
- 11632 Laing St
- 11521 Whitehill St
- 12014 Duchess St
- 11382 Rossiter St
- 11772 Duchess St
- 12056 Duchess St
- 11059 Lakepointe St
- 11110 Wayburn St
- 12136 Duchess St
- 11630 Duchess St
- 12076 Laing St
- 12146 Duchess St
- 11921 Riad St
- 11655 Lansdowne St
- 11671 Lansdowne St Unit Bldg-Unit
- 11671 Lansdowne St
- 11645 Lansdowne St
- 11681 Lansdowne St
- 11637 Lansdowne St
- 11691 Lansdowne St
- 11760 Whitehill St
- 11768 Whitehill St
- 11750 Whitehill St
- 11774 Whitehill St
- 11742 Whitehill St
- 11631 Lansdowne St
- 11699 Lansdowne St
- 11782 Whitehill St
- 11730 Whitehill St
- 11666 Lansdowne St
- 11790 Whitehill St
- 11656 Lansdowne St
- 11676 Lansdowne St