Estimated Value: $887,703
3
Beds
2
Baths
1,928
Sq Ft
$460/Sq Ft
Est. Value
About This Home
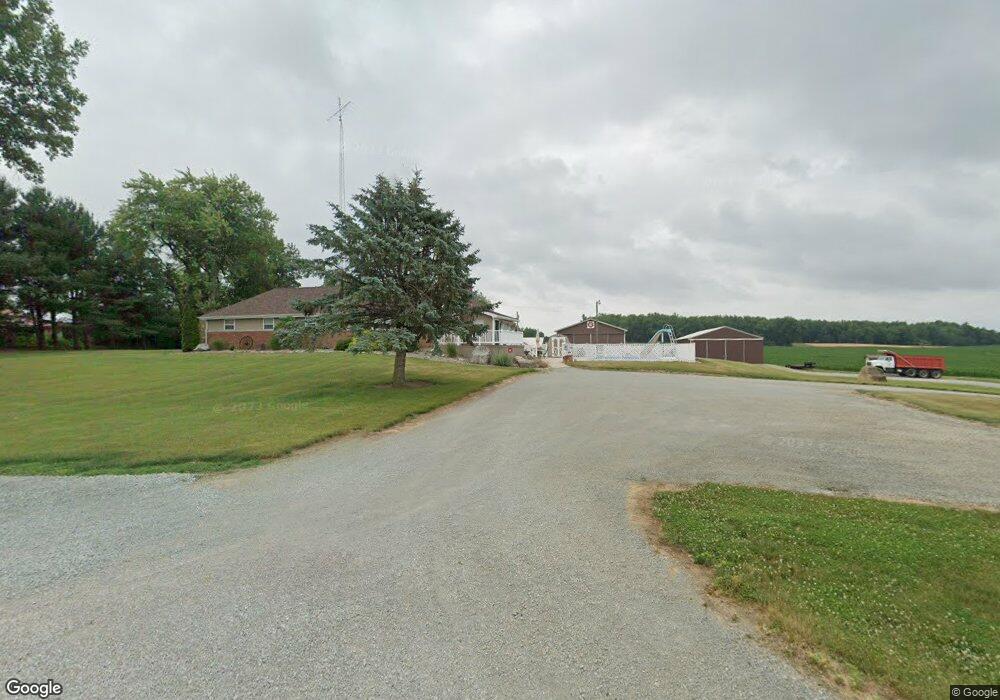
This home is located at 11669 19th Rd, Argos, IN 46501 and is currently estimated at $887,703, approximately $460 per square foot. 11669 19th Rd is a home located in Marshall County with nearby schools including Argos Community Elementary School and Argos Community Junior-Senior High School.
Ownership History
Date
Name
Owned For
Owner Type
Purchase Details
Closed on
May 25, 2022
Sold by
Johnson Dennis D and Johnson Leah B
Bought by
Bollenbacher Rodney D and Bollenbacher Nicholas
Current Estimated Value
Home Financials for this Owner
Home Financials are based on the most recent Mortgage that was taken out on this home.
Original Mortgage
$218,120
Outstanding Balance
$157,342
Interest Rate
5.1%
Mortgage Type
New Conventional
Estimated Equity
$730,361
Create a Home Valuation Report for This Property
The Home Valuation Report is an in-depth analysis detailing your home's value as well as a comparison with similar homes in the area
Purchase History
| Date | Buyer | Sale Price | Title Company |
|---|---|---|---|
| Bollenbacher Rodney D | -- | None Listed On Document | |
| Johnson Dennis D | -- | None Listed On Document |
Source: Public Records
Mortgage History
| Date | Status | Borrower | Loan Amount |
|---|---|---|---|
| Open | Johnson Dennis D | $218,120 | |
| Closed | Bollenbacher Rodney D | $218,120 |
Source: Public Records
Tax History
| Year | Tax Paid | Tax Assessment Tax Assessment Total Assessment is a certain percentage of the fair market value that is determined by local assessors to be the total taxable value of land and additions on the property. | Land | Improvement |
|---|---|---|---|---|
| 2024 | $2,847 | $176,900 | $176,900 | -- |
| 2022 | $2,847 | $335,800 | $171,400 | $164,400 |
| 2021 | $4,533 | $278,300 | $147,800 | $130,500 |
| 2020 | $3,626 | $271,900 | $145,300 | $126,600 |
| 2019 | $3,798 | $283,400 | $166,100 | $117,300 |
| 2018 | $3,353 | $271,900 | $164,800 | $107,100 |
| 2017 | $3,875 | $287,000 | $183,700 | $103,300 |
| 2016 | $3,976 | $293,800 | $191,800 | $102,000 |
| 2014 | $3,359 | $286,400 | $204,400 | $82,000 |
Source: Public Records
Map
Nearby Homes
- 15871 18th Rd
- 204 Fawn Ct
- 14036 20a Rd
- 3981 W State Road 110
- 314 W Walnut St
- ** State Road 10
- * State Road 10
- 413 E Albert St
- 645 Heritage St
- 0 N Michigan Rd Unit 202531722
- 385 E Marshall St
- *** **** Jarrah Rd
- *** *** Jarrah Rd
- 7697 20th Rd
- 19119 Queen Rd
- ** ** S Juniper Rd
- *** S Juniper Rd
- ** *** S Juniper Rd
- 16357 Rd
- 16357 16c Rd
Your Personal Tour Guide
Ask me questions while you tour the home.