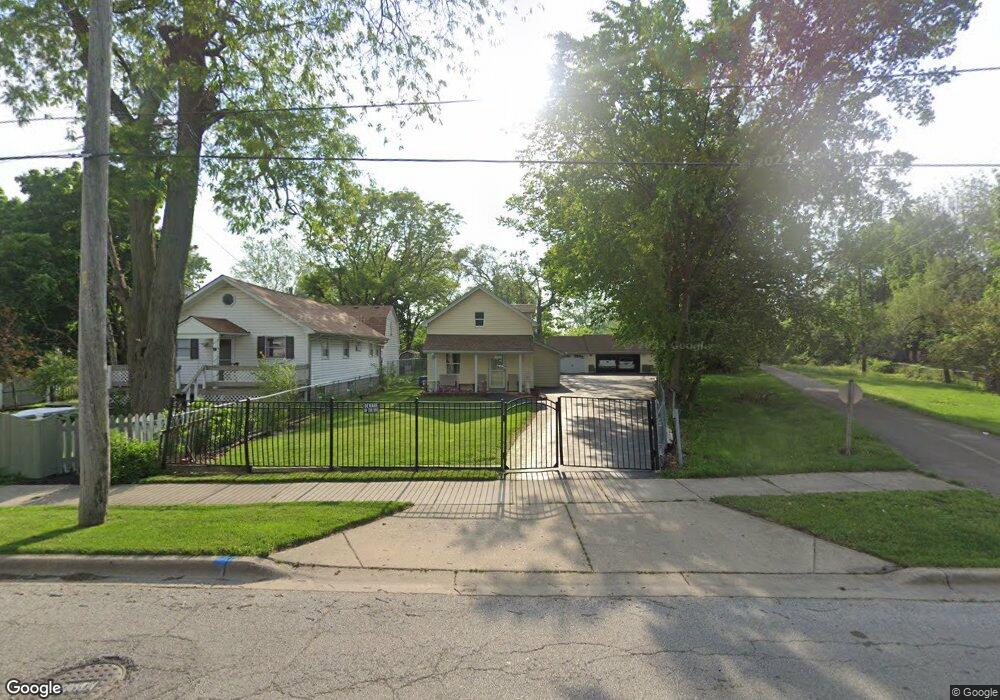
1167 5th St Aurora, IL 60505
Southeast Aurora NeighborhoodEstimated Value: $187,000 - $242,000
Studio
--
Bath
1,380
Sq Ft
$160/Sq Ft
Est. Value
About This Home
This home is located at 1167 5th St, Aurora, IL 60505 and is currently estimated at $221,109, approximately $160 per square foot. 1167 5th St is a home located in Kane County with nearby schools including Dieterich Elementary School, K D Waldo Middle School, and East Aurora High School.
Ownership History
Date
Name
Owned For
Owner Type
Purchase Details
Closed on
Aug 8, 2001
Sold by
Arriaga Alejandro and Arriaga Kristi
Bought by
Sosa Jorge Cepeda and Garcia Ernestina
Current Estimated Value
Home Financials for this Owner
Home Financials are based on the most recent Mortgage that was taken out on this home.
Original Mortgage
$105,346
Outstanding Balance
$41,331
Interest Rate
7.23%
Mortgage Type
FHA
Estimated Equity
$179,778
Create a Home Valuation Report for This Property
The Home Valuation Report is an in-depth analysis detailing your home's value as well as a comparison with similar homes in the area
Home Values in the Area
Average Home Value in this Area
Purchase History
| Date | Buyer | Sale Price | Title Company |
|---|---|---|---|
| Sosa Jorge Cepeda | $107,000 | Ticor Title Insurance |
Source: Public Records
Mortgage History
| Date | Status | Borrower | Loan Amount |
|---|---|---|---|
| Open | Sosa Jorge Cepeda | $105,346 |
Source: Public Records
Tax History
| Year | Tax Paid | Tax Assessment Tax Assessment Total Assessment is a certain percentage of the fair market value that is determined by local assessors to be the total taxable value of land and additions on the property. | Land | Improvement |
|---|---|---|---|---|
| 2024 | $5,137 | $74,938 | $8,443 | $66,495 |
| 2023 | $5,004 | $66,957 | $7,544 | $59,413 |
| 2022 | $4,413 | $58,085 | $6,883 | $51,202 |
| 2021 | $4,366 | $54,078 | $6,408 | $47,670 |
| 2020 | $4,177 | $50,230 | $5,952 | $44,278 |
| 2019 | $4,101 | $46,540 | $5,515 | $41,025 |
| 2018 | $3,893 | $42,754 | $5,101 | $37,653 |
| 2017 | $3,686 | $37,585 | $4,700 | $32,885 |
| 2016 | $3,550 | $33,738 | $4,740 | $28,998 |
| 2015 | -- | $30,029 | $4,076 | $25,953 |
| 2014 | -- | $23,614 | $3,746 | $19,868 |
| 2013 | -- | $23,563 | $3,978 | $19,585 |
Source: Public Records
Map
Nearby Homes
Your Personal Tour Guide
Ask me questions while you tour the home.