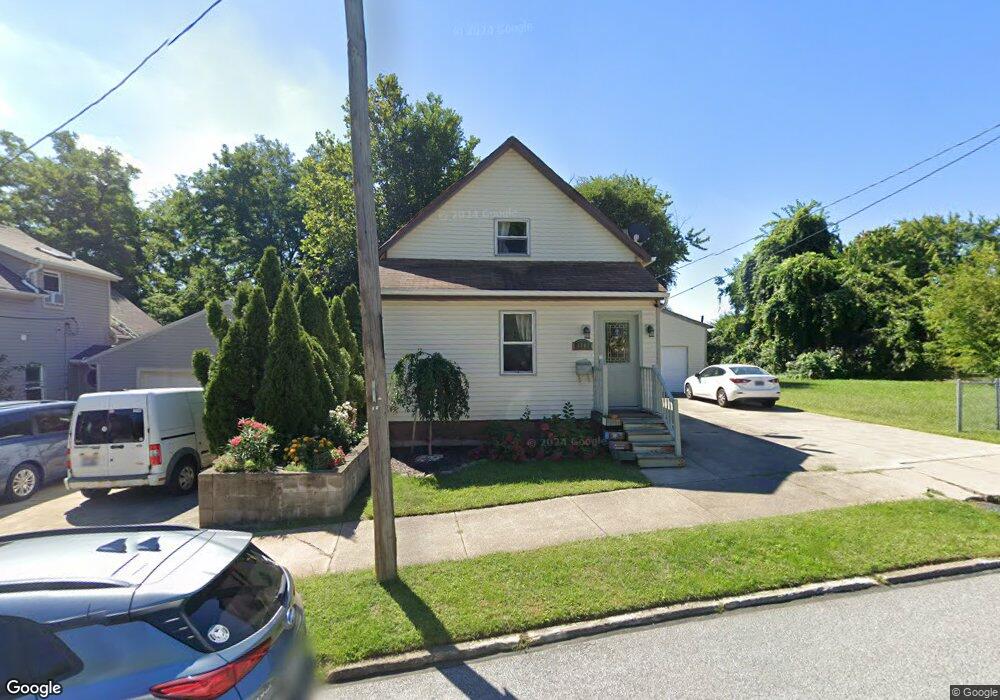
1167 Holmden Ave Cleveland, OH 44109
Tremont NeighborhoodEstimated Value: $132,885 - $275,000
3
Beds
1
Bath
1,011
Sq Ft
$177/Sq Ft
Est. Value
About This Home
This home is located at 1167 Holmden Ave, Cleveland, OH 44109 and is currently estimated at $179,221, approximately $177 per square foot. 1167 Holmden Ave is a home located in Cuyahoga County with nearby schools including Benjamin Franklin, Anton Grdina School, and Almira Academy.
Ownership History
Date
Name
Owned For
Owner Type
Purchase Details
Closed on
Jun 9, 2017
Sold by
Montgomery Margaret and Montgomery Margaret Goldie
Bought by
Cuyahoga County Land Reuitilization Corp
Current Estimated Value
Purchase Details
Closed on
Nov 7, 2013
Sold by
Jvd Asset Management Llc
Bought by
Asmar Properties Llc
Purchase Details
Closed on
Jan 16, 2013
Sold by
Kocuba Richard M and Kocuba Anna
Bought by
Jvd Asset Management Llc
Purchase Details
Closed on
Feb 21, 2006
Sold by
Kocuba Richard M and Kocuba Anna
Bought by
Steelyard Commons Llc
Purchase Details
Closed on
Jul 30, 2003
Sold by
Kocuba Richard M and Kocuba Ken
Bought by
Kocuba Richard M and Kocuba Anna
Purchase Details
Closed on
Jun 30, 2003
Sold by
Estate Of Anna Kocuba
Bought by
Kocuba Richard M and Kocuba Ken
Purchase Details
Closed on
May 15, 1987
Sold by
Kocuba John
Bought by
Kocuba Anna
Purchase Details
Closed on
Jan 1, 1975
Bought by
Kocuba John
Create a Home Valuation Report for This Property
The Home Valuation Report is an in-depth analysis detailing your home's value as well as a comparison with similar homes in the area
Home Values in the Area
Average Home Value in this Area
Purchase History
| Date | Buyer | Sale Price | Title Company |
|---|---|---|---|
| Cuyahoga County Land Reuitilization Corp | -- | None Available | |
| Asmar Properties Llc | $11,000 | Northstar Title Agency | |
| Jvd Asset Management Llc | -- | First Security Title Cof | |
| Steelyard Commons Llc | $7,000 | Chicago Title Ins Co | |
| Kocuba Richard M | -- | -- | |
| Kocuba Richard M | -- | -- | |
| Kocuba Anna | -- | -- | |
| Kocuba John | -- | -- |
Source: Public Records
Tax History Compared to Growth
Tax History
| Year | Tax Paid | Tax Assessment Tax Assessment Total Assessment is a certain percentage of the fair market value that is determined by local assessors to be the total taxable value of land and additions on the property. | Land | Improvement |
|---|---|---|---|---|
| 2024 | $2,996 | $44,800 | $18,725 | $26,075 |
| 2023 | $2,760 | $35,600 | $10,260 | $25,340 |
| 2022 | $2,744 | $35,600 | $10,260 | $25,340 |
| 2021 | $2,718 | $35,600 | $10,260 | $25,340 |
| 2020 | $2,557 | $28,950 | $8,330 | $20,620 |
| 2019 | $2,369 | $82,700 | $23,800 | $58,900 |
| 2018 | $1,872 | $28,950 | $8,330 | $20,620 |
| 2017 | $1,394 | $16,490 | $8,330 | $8,160 |
| 2016 | $1,384 | $16,490 | $8,330 | $8,160 |
| 2015 | $1,139 | $16,490 | $8,330 | $8,160 |
| 2014 | $1,139 | $13,520 | $6,830 | $6,690 |
Source: Public Records
Map
Nearby Homes
- 1219 Buhrer Ave
- 1431 Rowley Ave
- 1632 Holmden Ave
- 3002 W 11th St
- 3133 W 17th St
- V/L W 16th St
- 3127 W 17th Place
- 2962 W 14th St
- 2950 W 14th St
- 1717 Clark Ave
- 1911 Corning Ave
- 3145 Scranton Rd
- 2863 W 12th St
- 3190 Scranton Rd
- 2002 Valentine Ave
- 2973 Scranton Rd
- 3288 Scranton Rd
- 3273 & 3271 W 23rd Place
- 3293 W 23rd Place
- 3290 W 23rd Place
- 1171 Holmden Ave
- 1175 Holmden Ave
- 1159 Holmden Ave
- 1179 Holmden Ave
- 1183 Holmden Ave
- 1162 Holmden Ave
- 1172 Holmden Ave
- 1176 Holmden Ave
- 1191 Holmden Ave
- 1180 Holmden Ave
- 1182 Holmden Ave
- 1156 Holmden Ave
- 1184 Holmden Ave
- 1150 Holmden Ave
- 1193 Holmden Ave
- 1148 Holmden Ave
- 1146 Holmden Ave
- 1192 Holmden Ave
- 1142 Holmden Ave
- 1196 Holmden Ave