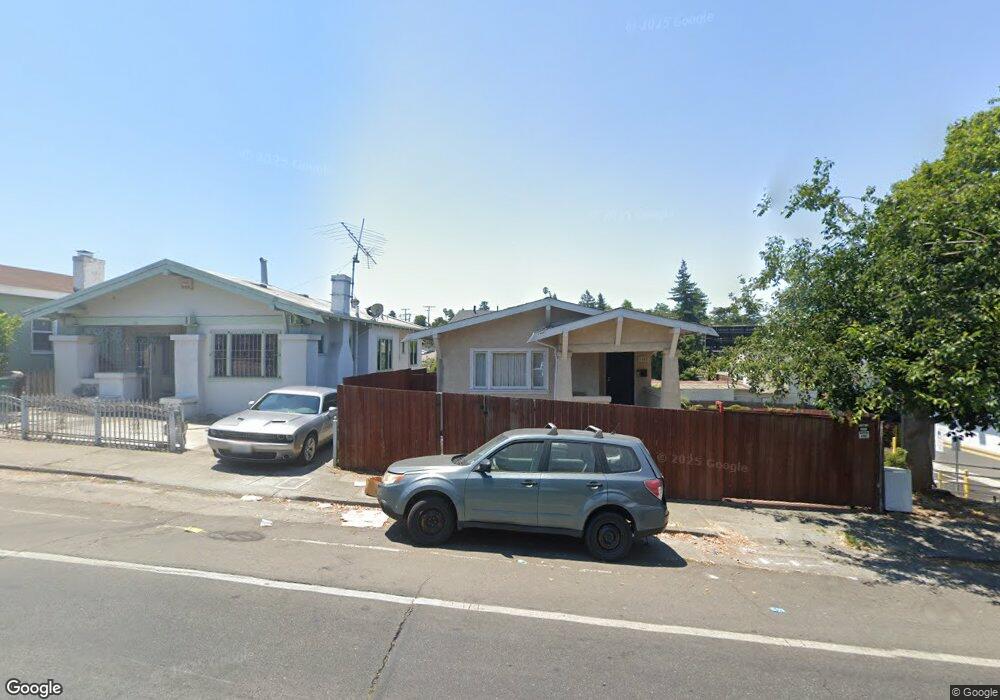
1167 Macarthur Blvd Oakland, CA 94610
Lynn NeighborhoodEstimated Value: $665,000 - $1,140,000
--
Bed
2
Baths
1,807
Sq Ft
$495/Sq Ft
Est. Value
About This Home
This home is located at 1167 Macarthur Blvd, Oakland, CA 94610 and is currently estimated at $894,359, approximately $494 per square foot. 1167 Macarthur Blvd is a home located in Alameda County with nearby schools including Bella Vista Elementary School, Edna Brewer Middle School, and Oakland High School.
Ownership History
Date
Name
Owned For
Owner Type
Purchase Details
Closed on
Jun 3, 2014
Sold by
Home Run Real Estate Investments Inc
Bought by
Wiley Samuel Howard and Wiley Karly
Current Estimated Value
Home Financials for this Owner
Home Financials are based on the most recent Mortgage that was taken out on this home.
Original Mortgage
$549,857
Outstanding Balance
$420,892
Interest Rate
4.37%
Mortgage Type
FHA
Estimated Equity
$473,467
Purchase Details
Closed on
Oct 9, 2013
Sold by
Payne Irene and The Lovelle Elaine Jones 2011
Bought by
Home Run Real Estate Investments Inc
Home Financials for this Owner
Home Financials are based on the most recent Mortgage that was taken out on this home.
Original Mortgage
$250,000
Interest Rate
4.55%
Mortgage Type
Balloon
Purchase Details
Closed on
Apr 1, 2011
Sold by
Jones Lovelle Elaine
Bought by
Revo Jones Lovelle Elaine and Revo Lovelle Ealien Jones 2011
Create a Home Valuation Report for This Property
The Home Valuation Report is an in-depth analysis detailing your home's value as well as a comparison with similar homes in the area
Home Values in the Area
Average Home Value in this Area
Purchase History
| Date | Buyer | Sale Price | Title Company |
|---|---|---|---|
| Wiley Samuel Howard | $560,000 | Chicago Title Company | |
| Home Run Real Estate Investments Inc | $275,000 | Chicago Title Company | |
| Revo Jones Lovelle Elaine | -- | None Available |
Source: Public Records
Mortgage History
| Date | Status | Borrower | Loan Amount |
|---|---|---|---|
| Open | Wiley Samuel Howard | $549,857 | |
| Previous Owner | Home Run Real Estate Investments Inc | $250,000 |
Source: Public Records
Tax History Compared to Growth
Tax History
| Year | Tax Paid | Tax Assessment Tax Assessment Total Assessment is a certain percentage of the fair market value that is determined by local assessors to be the total taxable value of land and additions on the property. | Land | Improvement |
|---|---|---|---|---|
| 2025 | $11,131 | $710,249 | $205,936 | $504,313 |
| 2024 | $11,131 | $696,326 | $201,899 | $494,427 |
| 2023 | $11,654 | $682,674 | $197,940 | $484,734 |
| 2022 | $11,284 | $669,290 | $194,060 | $475,230 |
| 2021 | $10,740 | $656,172 | $190,256 | $465,916 |
| 2020 | $10,621 | $649,445 | $188,306 | $461,139 |
| 2019 | $10,191 | $636,715 | $184,615 | $452,100 |
| 2018 | $14,427 | $624,235 | $180,996 | $443,239 |
| 2017 | $9,584 | $611,997 | $177,448 | $434,549 |
| 2016 | $9,287 | $599,998 | $173,969 | $426,029 |
| 2015 | $9,183 | $586,888 | $171,356 | $415,532 |
| 2014 | $5,086 | $275,000 | $175,000 | $100,000 |
Source: Public Records
Map
Nearby Homes
- 1000 E 33rd St
- 1019 E 33rd St
- 3622 Emerson St
- 3214 13th Ave
- 1001 Macarthur Blvd
- 3747 Park Boulevard Way
- 2840 11th Ave
- 1342 E 31st St
- 2823 11th Ave Unit C
- 2823 11th Ave Unit B
- 1458 E 33rd St
- 901 E 28th St
- 2737 12th Ave
- 2728 12th Ave
- 963 Grosvenor Place
- 2821 Vallecito Place
- 2760 Park Blvd
- 806 Northvale Rd
- 1171 Macarthur Blvd
- 1173 Macarthur Blvd
- 1179 Macarthur Blvd
- 1216 E 34th St
- 1201 Macarthur Blvd
- 1224 E 34th St
- 1230 E 34th St
- 1212 E 34th St
- 1205 Macarthur Blvd
- 1232 E 34th St
- 1209 Macarthur Blvd
- 1234 E 34th St
- 1213 Macarthur Blvd
- 1238 E 34th St
- 1219 Macarthur Blvd
- 1225 E 34th St
- 1240 E 34th St
- 1225 Macarthur Blvd
- 1217 E 34th St
- 1211 E 34th St