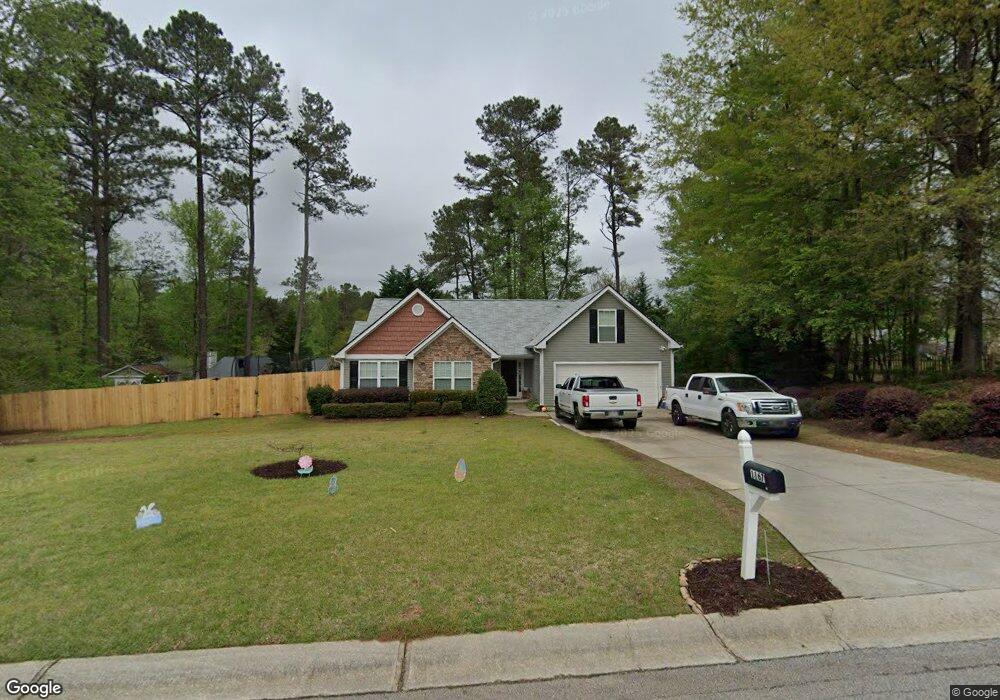
1167 Otis Dr Unit 65 Bethlehem, GA 30620
Estimated Value: $348,000 - $383,000
4
Beds
3
Baths
1,926
Sq Ft
$191/Sq Ft
Est. Value
About This Home
This home is located at 1167 Otis Dr Unit 65, Bethlehem, GA 30620 and is currently estimated at $367,638, approximately $190 per square foot. 1167 Otis Dr Unit 65 is a home located in Barrow County with nearby schools including Yargo Elementary School, Haymon-Morris Middle School, and Apalachee High School.
Ownership History
Date
Name
Owned For
Owner Type
Purchase Details
Closed on
Apr 30, 2021
Sold by
Arenas Judy Ann
Bought by
Patino Jose A Patino
Current Estimated Value
Home Financials for this Owner
Home Financials are based on the most recent Mortgage that was taken out on this home.
Original Mortgage
$232,000
Outstanding Balance
$210,250
Interest Rate
3.1%
Mortgage Type
New Conventional
Estimated Equity
$157,388
Purchase Details
Closed on
Nov 7, 2014
Sold by
Arenas Judy Ann
Bought by
Arenas Judy Ann As Trustee Of The
Purchase Details
Closed on
May 15, 2009
Sold by
Crown Park Homes Of Cambridge
Bought by
Arenas Judy A
Purchase Details
Closed on
Jun 11, 2004
Sold by
Millstone Development Group In
Bought by
Crown Park Homes At Cambridge Llc
Purchase Details
Closed on
Apr 1, 2004
Bought by
Millstone Development Group Inc
Create a Home Valuation Report for This Property
The Home Valuation Report is an in-depth analysis detailing your home's value as well as a comparison with similar homes in the area
Home Values in the Area
Average Home Value in this Area
Purchase History
| Date | Buyer | Sale Price | Title Company |
|---|---|---|---|
| Patino Jose A Patino | $290,000 | -- | |
| Arenas Judy Ann As Trustee Of The | -- | -- | |
| Arenas Judy A | $147,900 | -- | |
| Crown Park Homes At Cambridge Llc | $38,500 | -- | |
| Millstone Development Group Inc | -- | -- |
Source: Public Records
Mortgage History
| Date | Status | Borrower | Loan Amount |
|---|---|---|---|
| Open | Patino Jose A Patino | $232,000 |
Source: Public Records
Tax History Compared to Growth
Tax History
| Year | Tax Paid | Tax Assessment Tax Assessment Total Assessment is a certain percentage of the fair market value that is determined by local assessors to be the total taxable value of land and additions on the property. | Land | Improvement |
|---|---|---|---|---|
| 2024 | $3,733 | $148,952 | $28,000 | $120,952 |
| 2023 | $3,537 | $141,237 | $28,000 | $113,237 |
| 2022 | $3,377 | $116,187 | $22,400 | $93,787 |
| 2021 | $2,316 | $73,821 | $18,000 | $55,821 |
| 2020 | $2,183 | $69,202 | $18,000 | $51,202 |
| 2019 | $2,221 | $69,202 | $18,000 | $51,202 |
| 2018 | $1,972 | $65,402 | $14,200 | $51,202 |
| 2017 | $1,627 | $55,890 | $14,200 | $41,690 |
| 2016 | $1,438 | $48,986 | $14,200 | $34,786 |
| 2015 | $1,453 | $49,356 | $14,200 | $35,156 |
| 2014 | $1,282 | $43,365 | $7,840 | $35,525 |
| 2013 | -- | $40,746 | $7,840 | $32,906 |
Source: Public Records
Map
Nearby Homes
- 1164 Otis Dr
- 1024 Lyndhurst Ln
- 704 Newnham Walk
- 1111 Otis Dr
- 1129 Loganville Hwy
- 738 Worth Ct
- 724 Westbury Dr
- 720 Westbury Ct
- 209 Angie Way
- 73 Silverleaf Trail
- 268 Silverleaf Trail
- 934 Beaver Hill Dr
- 64 Silverleaf Trail
- 280 Silverleaf Trail
- 1529 Blakewood Trail
- 303 Ron Dr
- 362 Silverleaf Trail
- Lancaster Plan at The Estates at Casteel
- Buckley Plan at The Estates at Casteel
- Cardiff Plan at The Estates at Casteel
- 1167 Otis Dr
- 1202 1202 Benton Ct
- 0 Benton Ct
- 1202 Benton Ct
- 600 Mcdowell Ln
- 1200 Benton Ct
- 1166 Otis Dr
- 1160 Otis Dr
- 1171 Otis Dr Unit 64
- 1171 Otis Dr
- 1204 Benton Ct
- 1170 Otis Dr
- 1158 Otis Dr
- 601 Mcdowell Ln
- 1172 Otis Dr
- 605 Mcdowell Ln Unit 75
- 605 Mcdowell Ln
- 1203 Benton Ct
- 603 Mcdowell Ln
- 603 Mcdowell Ln Unit GA14369