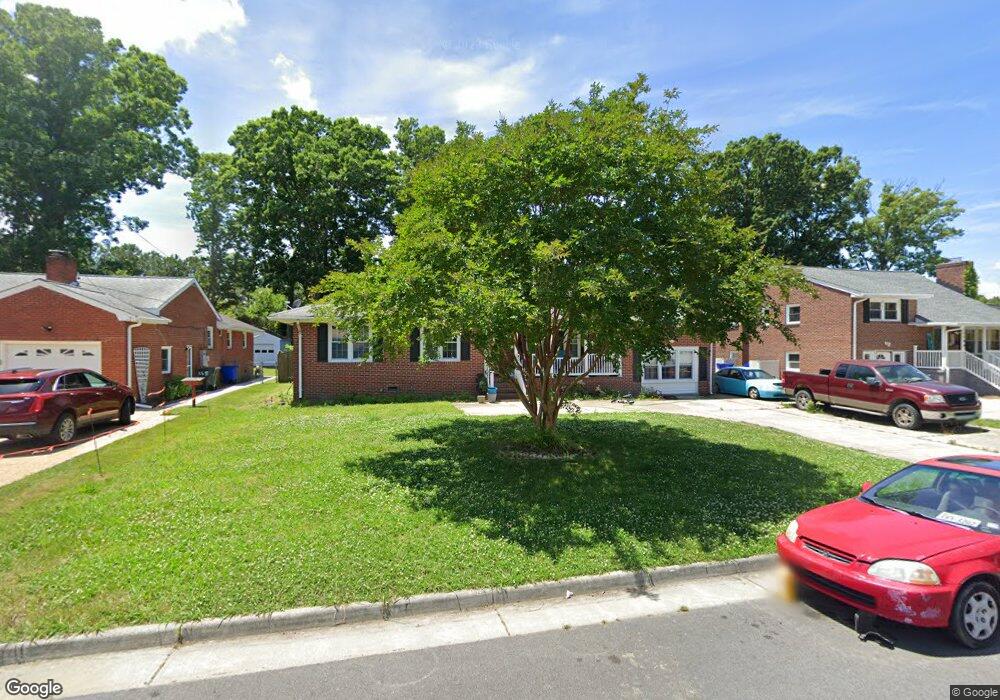
1167 Tyler Ave Newport News, VA 23601
Green Oaks NeighborhoodEstimated Value: $302,000 - $340,403
4
Beds
2
Baths
2,014
Sq Ft
$157/Sq Ft
Est. Value
About This Home
This home is located at 1167 Tyler Ave, Newport News, VA 23601 and is currently estimated at $315,851, approximately $156 per square foot. 1167 Tyler Ave is a home located in Newport News City with nearby schools including Sedgefield Elementary School, Homer L. Hines Middle School, and Warwick High School.
Ownership History
Date
Name
Owned For
Owner Type
Purchase Details
Closed on
Apr 7, 2020
Sold by
Griffin Relma
Bought by
Smith Deborah E
Current Estimated Value
Home Financials for this Owner
Home Financials are based on the most recent Mortgage that was taken out on this home.
Original Mortgage
$216,015
Outstanding Balance
$192,432
Interest Rate
3.7%
Mortgage Type
FHA
Estimated Equity
$123,419
Purchase Details
Closed on
Aug 31, 1999
Sold by
Turner Rene
Bought by
Griffen Reima
Home Financials for this Owner
Home Financials are based on the most recent Mortgage that was taken out on this home.
Original Mortgage
$116,368
Interest Rate
7.5%
Create a Home Valuation Report for This Property
The Home Valuation Report is an in-depth analysis detailing your home's value as well as a comparison with similar homes in the area
Home Values in the Area
Average Home Value in this Area
Purchase History
| Date | Buyer | Sale Price | Title Company |
|---|---|---|---|
| Smith Deborah E | $220,000 | Insight Title & Stlmnt Svcs | |
| Griffen Reima | $117,000 | -- |
Source: Public Records
Mortgage History
| Date | Status | Borrower | Loan Amount |
|---|---|---|---|
| Open | Smith Deborah E | $216,015 | |
| Previous Owner | Griffen Reima | $116,368 |
Source: Public Records
Tax History Compared to Growth
Tax History
| Year | Tax Paid | Tax Assessment Tax Assessment Total Assessment is a certain percentage of the fair market value that is determined by local assessors to be the total taxable value of land and additions on the property. | Land | Improvement |
|---|---|---|---|---|
| 2024 | $3,645 | $308,900 | $60,000 | $248,900 |
| 2023 | $3,575 | $290,500 | $60,000 | $230,500 |
| 2022 | $3,279 | $261,000 | $60,000 | $201,000 |
| 2021 | $2,740 | $224,600 | $54,500 | $170,100 |
| 2020 | $2,548 | $196,800 | $54,500 | $142,300 |
| 2019 | $2,493 | $192,700 | $54,500 | $138,200 |
| 2018 | $2,490 | $192,700 | $54,500 | $138,200 |
| 2017 | $2,366 | $182,500 | $54,500 | $128,000 |
| 2016 | $2,362 | $182,500 | $54,500 | $128,000 |
| 2015 | $2,437 | $189,200 | $54,500 | $134,700 |
| 2014 | $2,280 | $199,200 | $54,500 | $144,700 |
Source: Public Records
Map
Nearby Homes