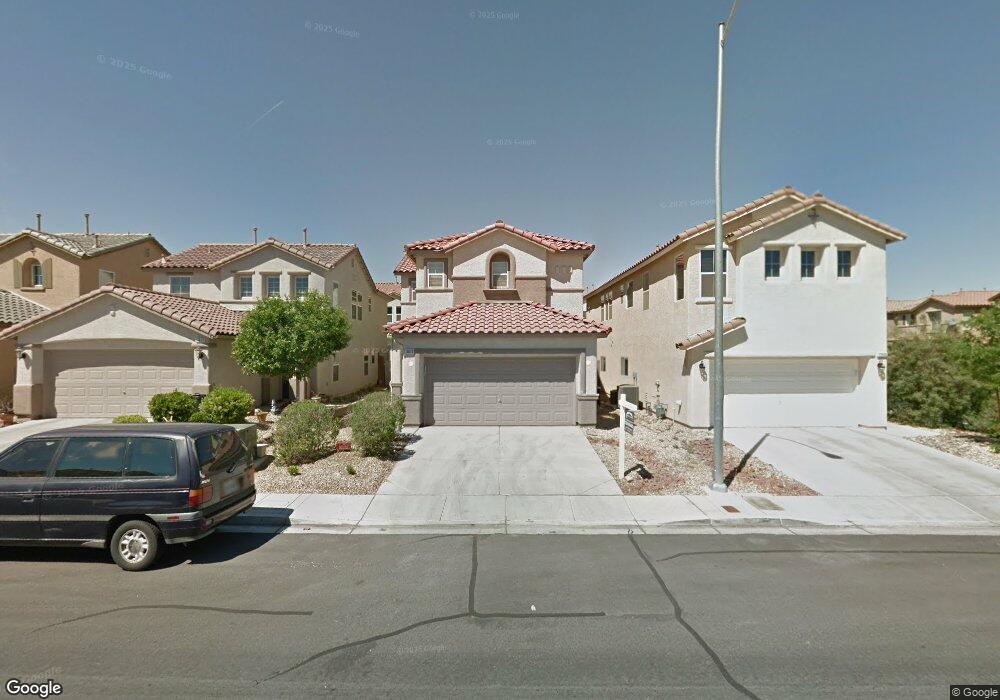
11673 Splendor View Dr Unit 2 Las Vegas, NV 89183
Silverado Ranch NeighborhoodEstimated Value: $478,708 - $488,000
4
Beds
3
Baths
2,282
Sq Ft
$212/Sq Ft
Est. Value
About This Home
This home is located at 11673 Splendor View Dr Unit 2, Las Vegas, NV 89183 and is currently estimated at $482,927, approximately $211 per square foot. 11673 Splendor View Dr Unit 2 is a home located in Clark County with nearby schools including Steve Schorr Elementary School, Del E. Webb Middle School, and Liberty High School.
Ownership History
Date
Name
Owned For
Owner Type
Purchase Details
Closed on
May 24, 2011
Sold by
Gy Residential Investments Llc
Bought by
Hermosillo Michael S and Hermosillo Deborah A
Current Estimated Value
Home Financials for this Owner
Home Financials are based on the most recent Mortgage that was taken out on this home.
Original Mortgage
$150,096
Outstanding Balance
$104,262
Interest Rate
4.87%
Mortgage Type
FHA
Estimated Equity
$378,665
Purchase Details
Closed on
Apr 5, 2011
Sold by
Tucker Gregory R and Tucker Susan
Bought by
Gy Residential Investments Llc
Home Financials for this Owner
Home Financials are based on the most recent Mortgage that was taken out on this home.
Original Mortgage
$150,096
Outstanding Balance
$104,262
Interest Rate
4.87%
Mortgage Type
FHA
Estimated Equity
$378,665
Purchase Details
Closed on
May 23, 2006
Sold by
Kb Home Nevada Inc
Bought by
Tucker Gregory R and Tucker Susan
Home Financials for this Owner
Home Financials are based on the most recent Mortgage that was taken out on this home.
Original Mortgage
$328,860
Interest Rate
6.46%
Mortgage Type
Fannie Mae Freddie Mac
Create a Home Valuation Report for This Property
The Home Valuation Report is an in-depth analysis detailing your home's value as well as a comparison with similar homes in the area
Home Values in the Area
Average Home Value in this Area
Purchase History
| Date | Buyer | Sale Price | Title Company |
|---|---|---|---|
| Hermosillo Michael S | $156,000 | Fidelity National Title Las | |
| Gy Residential Investments Llc | $120,300 | None Available | |
| Tucker Gregory R | $378,515 | First Amer Title Co Of Nv |
Source: Public Records
Mortgage History
| Date | Status | Borrower | Loan Amount |
|---|---|---|---|
| Open | Hermosillo Michael S | $150,096 | |
| Previous Owner | Tucker Gregory R | $328,860 |
Source: Public Records
Tax History Compared to Growth
Tax History
| Year | Tax Paid | Tax Assessment Tax Assessment Total Assessment is a certain percentage of the fair market value that is determined by local assessors to be the total taxable value of land and additions on the property. | Land | Improvement |
|---|---|---|---|---|
| 2025 | $2,511 | $133,551 | $39,200 | $94,351 |
| 2024 | $2,326 | $133,551 | $39,200 | $94,351 |
| 2023 | $2,326 | $122,523 | $33,950 | $88,573 |
| 2022 | $2,154 | $108,567 | $27,650 | $80,917 |
| 2021 | $1,994 | $101,957 | $25,200 | $76,757 |
| 2020 | $1,849 | $101,224 | $25,200 | $76,024 |
| 2019 | $1,733 | $96,727 | $22,050 | $74,677 |
| 2018 | $1,654 | $88,731 | $17,500 | $71,231 |
| 2017 | $2,585 | $88,144 | $16,100 | $72,044 |
| 2016 | $1,549 | $74,128 | $12,950 | $61,178 |
| 2015 | $1,619 | $55,514 | $9,450 | $46,064 |
| 2014 | $1,497 | $49,515 | $5,250 | $44,265 |
Source: Public Records
Map
Nearby Homes
- 11668 Tierney Creek Dr
- 11609 Andorra St
- 326 E Neal Ave
- 218 Lantana Breeze Dr
- 3758 Bright Aquarius Ln
- 3724 Canis Minor Ln Unit 21101
- 1271 Dorado Sea Ct
- 1267 Dorado Sea Ct
- 3717 Canis Minor Ln Unit 11101
- 11819 Bella Luna St
- 11771 Bergamo Ct
- 178 Elexese Ct
- 144 Bella Milano Ave
- 11769 Elianto St
- 11560 S Stivali St
- The Jefferson Plan at Liberty - Series 1
- The Hamilton Plan at Liberty - Series 1
- The Fraklin Plan at Liberty - Series 1
- Cesena Plan at Liberty - Series 3
- Layton Plan at Liberty - Series 2
- 11677 Splendor View Dr
- 11669 Splendor View Dr
- 11681 Splendor View Dr Unit None
- 11681 Splendor View Dr
- 11672 Tierney Creek Dr
- 11685 Splendor View Dr
- 11676 Tierney Creek Dr Unit 2
- 11680 Tierney Creek Dr
- 11689 Splendor View Dr
- 11689 Splendor View Dr
- 11689 Splendor View Dr
- 11684 Tierney Creek Dr Unit 2
- 11674 Splendor View Dr
- 11670 Splendor View Dr
- 11678 Splendor View Dr Unit 2
- 326 Windsor Ridge Ave
- 324 Windsor Ridge Ave
- 328 Windsor Ridge Ave
- 322 Windsor Ridge Ave
- 11688 Tierney Creek Dr