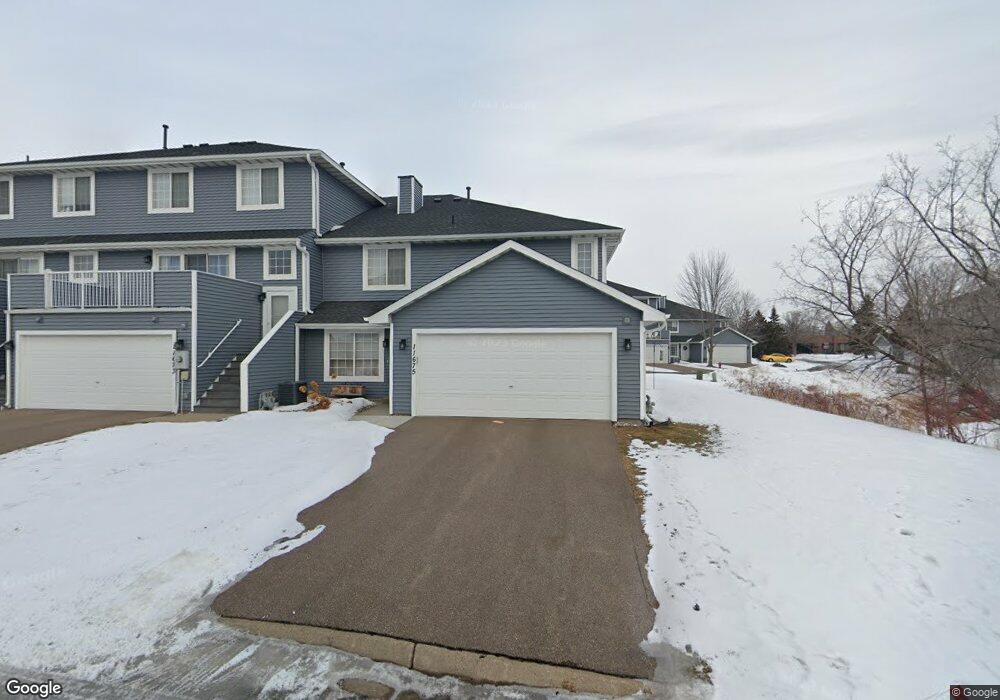
11675 Millpond Ave Unit 51 Burnsville, MN 55337
Estimated Value: $238,000 - $250,000
2
Beds
2
Baths
1,312
Sq Ft
$186/Sq Ft
Est. Value
About This Home
This home is located at 11675 Millpond Ave Unit 51, Burnsville, MN 55337 and is currently estimated at $243,855, approximately $185 per square foot. 11675 Millpond Ave Unit 51 is a home located in Dakota County with nearby schools including Burnsville High School, Gateway STEM Academy, and Sunrise International Montessori School.
Ownership History
Date
Name
Owned For
Owner Type
Purchase Details
Closed on
Jul 16, 2025
Sold by
State Of Minnesota
Bought by
City Of Burnsville
Current Estimated Value
Purchase Details
Closed on
Jun 3, 2022
Sold by
Onken Roger
Bought by
Taylor Haley
Home Financials for this Owner
Home Financials are based on the most recent Mortgage that was taken out on this home.
Original Mortgage
$241,900
Interest Rate
5.11%
Mortgage Type
New Conventional
Purchase Details
Closed on
Nov 27, 2019
Sold by
Kurtz Glen and Kurtz Susan
Bought by
Onken Roger
Purchase Details
Closed on
Dec 14, 2017
Sold by
Nelberg Sharon D
Bought by
Kurtz Glen and Kurtz Susan
Purchase Details
Closed on
Jan 3, 2002
Sold by
Nelson Robb A and Nelson Debra R
Bought by
Nelberg Sharon
Purchase Details
Closed on
Sep 29, 1997
Sold by
Delta Development Inc
Bought by
Nelson Robb A and Nelson Debra R
Create a Home Valuation Report for This Property
The Home Valuation Report is an in-depth analysis detailing your home's value as well as a comparison with similar homes in the area
Home Values in the Area
Average Home Value in this Area
Purchase History
| Date | Buyer | Sale Price | Title Company |
|---|---|---|---|
| City Of Burnsville | -- | None Listed On Document | |
| Taylor Haley | $242,000 | -- | |
| Onken Roger | $194,500 | Burnet Title | |
| Kurtz Glen | $160,000 | Home Title Inc | |
| Nelberg Sharon | $149,900 | -- | |
| Nelson Robb A | $94,915 | -- |
Source: Public Records
Mortgage History
| Date | Status | Borrower | Loan Amount |
|---|---|---|---|
| Previous Owner | Taylor Haley | $241,900 |
Source: Public Records
Tax History Compared to Growth
Tax History
| Year | Tax Paid | Tax Assessment Tax Assessment Total Assessment is a certain percentage of the fair market value that is determined by local assessors to be the total taxable value of land and additions on the property. | Land | Improvement |
|---|---|---|---|---|
| 2024 | $2,132 | $200,900 | $40,700 | $160,200 |
| 2023 | $2,132 | $216,400 | $40,800 | $175,600 |
| 2022 | $1,832 | $199,000 | $40,700 | $158,300 |
| 2021 | $1,734 | $186,800 | $35,400 | $151,400 |
| 2020 | $1,610 | $170,300 | $33,700 | $136,600 |
| 2019 | $1,838 | $155,100 | $32,100 | $123,000 |
| 2018 | $1,494 | $147,800 | $29,700 | $118,100 |
| 2017 | $1,434 | $136,200 | $27,500 | $108,700 |
| 2016 | $1,394 | $130,600 | $26,200 | $104,400 |
| 2015 | $1,232 | $97,484 | $20,033 | $77,451 |
| 2014 | -- | $89,091 | $18,372 | $70,719 |
| 2013 | -- | $78,518 | $15,674 | $62,844 |
Source: Public Records
Map
Nearby Homes
- 2200 Horizon Rd
- 11900 Highland View Cir
- 3017 Mcleod St
- 2329 Explorer Ct
- 1853 Riverwood Dr Unit 4
- 1800 Riverwood Dr Unit 110
- 1800 Riverwood Dr Unit 323
- 11311 W River Hills Dr
- 11902 River Hills Cir
- 11921 Baypoint Dr
- 2001 Woods Ln
- 1601 Raleigh Dr
- 11036 27th Ave S
- 11459 Galtier Dr
- 11115 Carver Ct
- 11017 27th Ave S
- 3309 Red Oak Cir N
- 1609 Riverwood Dr
- 10934 Southview Dr
- 2005 E 122nd St Unit A7
- 11675 Millpond Ave Unit 5
- 11671 Millpond Ave
- 11671 Millpond Ave Unit 157
- 2465 E 117th St
- 11775 Millpond Ave Unit 101
- 11773 Millpond Ave Unit 100
- 11771 Millpond Ave Unit 99
- 11739 Millpond Ave
- 11711 Millpond Ave
- 11669 Millpond Ave
- 11673 Millpond Ave
- 11651 Millpond Ave
- 11657 Millpond Ave
- 2333 E 117th St Unit 33
- 2417 E 117th St
- 2449 E 117th St Unit 24
- 2547 E 117th St
- 11657 Millpond Ave Unit 43
- 2417 E 117th St Unit 28
- 11663 Millpond Ave