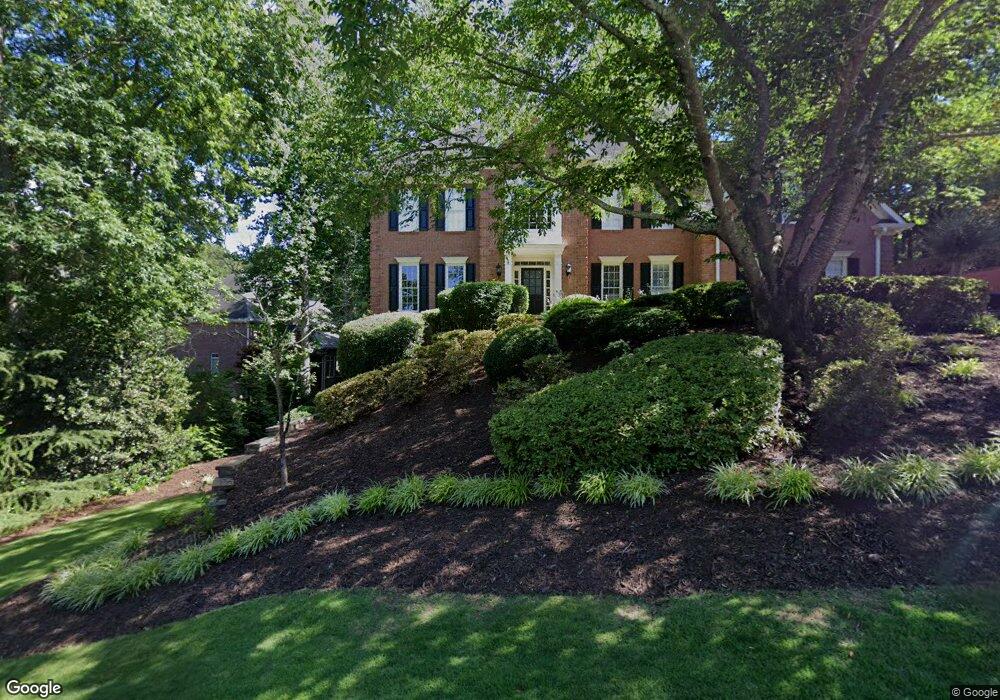
1168 Clarendon Dr Marietta, GA 30068
East Cobb NeighborhoodEstimated Value: $931,000 - $1,126,000
5
Beds
7
Baths
4,089
Sq Ft
$255/Sq Ft
Est. Value
About This Home
This home is located at 1168 Clarendon Dr, Marietta, GA 30068 and is currently estimated at $1,041,412, approximately $254 per square foot. 1168 Clarendon Dr is a home located in Cobb County with nearby schools including Mount Bethel Elementary School, Dickerson Middle School, and Walton High School.
Ownership History
Date
Name
Owned For
Owner Type
Purchase Details
Closed on
Apr 14, 2023
Sold by
Edmunds Mark K
Bought by
Willis Brandi H and Willis Patrick R
Current Estimated Value
Home Financials for this Owner
Home Financials are based on the most recent Mortgage that was taken out on this home.
Original Mortgage
$704,000
Outstanding Balance
$683,887
Interest Rate
6.65%
Mortgage Type
New Conventional
Estimated Equity
$357,525
Purchase Details
Closed on
Apr 27, 1994
Sold by
Howe Gary G Diane S
Bought by
Moore Robert L Gwendolyn
Home Financials for this Owner
Home Financials are based on the most recent Mortgage that was taken out on this home.
Original Mortgage
$269,900
Interest Rate
4.87%
Create a Home Valuation Report for This Property
The Home Valuation Report is an in-depth analysis detailing your home's value as well as a comparison with similar homes in the area
Home Values in the Area
Average Home Value in this Area
Purchase History
| Date | Buyer | Sale Price | Title Company |
|---|---|---|---|
| Willis Brandi H | $880,000 | None Listed On Document | |
| Moore Robert L Gwendolyn | $337,400 | -- |
Source: Public Records
Mortgage History
| Date | Status | Borrower | Loan Amount |
|---|---|---|---|
| Open | Willis Brandi H | $704,000 | |
| Previous Owner | Moore Robert L Gwendolyn | $269,900 |
Source: Public Records
Tax History Compared to Growth
Tax History
| Year | Tax Paid | Tax Assessment Tax Assessment Total Assessment is a certain percentage of the fair market value that is determined by local assessors to be the total taxable value of land and additions on the property. | Land | Improvement |
|---|---|---|---|---|
| 2025 | $9,940 | $342,084 | $92,000 | $250,084 |
| 2024 | $9,947 | $342,084 | $92,000 | $250,084 |
| 2023 | $8,247 | $330,788 | $80,000 | $250,788 |
| 2022 | $7,733 | $279,604 | $80,000 | $199,604 |
| 2021 | $7,225 | $256,396 | $80,000 | $176,396 |
| 2020 | $7,863 | $285,540 | $80,000 | $205,540 |
| 2019 | $7,863 | $285,540 | $80,000 | $205,540 |
| 2018 | $7,863 | $285,540 | $80,000 | $205,540 |
| 2017 | $6,950 | $259,160 | $78,000 | $181,160 |
| 2016 | $6,954 | $259,160 | $78,000 | $181,160 |
| 2015 | $7,117 | $259,160 | $78,000 | $181,160 |
| 2014 | $7,172 | $259,160 | $0 | $0 |
Source: Public Records
Map
Nearby Homes
- 5000 Lakeland Dr
- 1044 Little Willeo Rd Unit 1
- 1420 Lafayette Ln
- 5197 Forest Brook Pkwy
- 748 Olde Towne Ln
- 742 Olde Towne Ln
- 5157 Forest Brook Pkwy
- 748 Noble Oak Dr
- 4528 Lashley Ct NE
- 5184 Deering Trail Unit 2
- 4831 Emmitt Point NE
- 775 Hadley Ln NE
- 1382 Huntingford Dr Unit 2
- 767 Hadley Ln NE
- 4871 Karls Gate Dr
- 931 New Bedford Dr
- 1166 Clarendon Dr
- 1319 Garrick Way
- 1309 Garrick Way
- 1311 Garrick Way
- 1317 Garrick Way
- 1171 Clarendon Dr
- 1173 Clarendon Dr
- 1164 Clarendon Dr
- 1169 Clarendon Dr
- 1307 Garrick Way
- 1175 Clarendon Dr
- 1167 Clarendon Dr
- 1162 Clarendon Dr
- 1325 Garrick Way
- 1320 Garrick Way
- 1318 Garrick Way
- 1310 Garrick Way
- 1306 Garrick Way
- 1312 Garrick Way
- 1327 Garrick Way