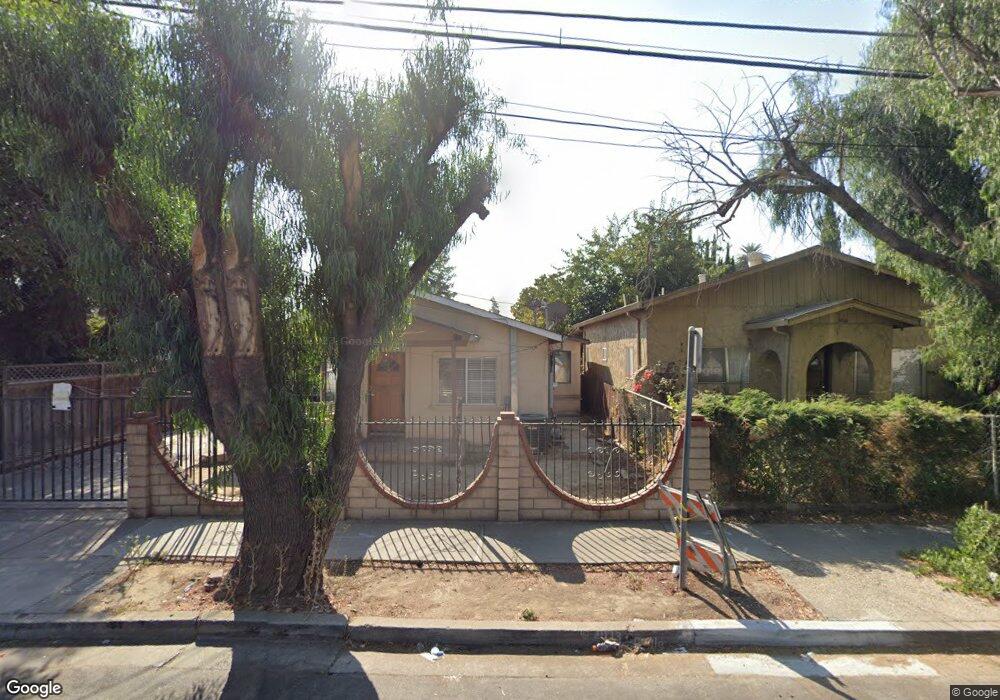
1168 Peach Ct San Jose, CA 95116
Brookwood Terrace NeighborhoodEstimated Value: $885,000 - $1,127,647
3
Beds
2
Baths
810
Sq Ft
$1,199/Sq Ft
Est. Value
About This Home
This home is located at 1168 Peach Ct, San Jose, CA 95116 and is currently estimated at $971,412, approximately $1,199 per square foot. 1168 Peach Ct is a home located in Santa Clara County with nearby schools including Selma Olinder Elementary School, Muwekma Ohlone Middle, and San Jose High School.
Ownership History
Date
Name
Owned For
Owner Type
Purchase Details
Closed on
May 3, 2022
Sold by
Parral Jeronimo Parredes and Parral Maria Rosalin
Bought by
Calderon J Ascencion J and Calderon Mabiela
Current Estimated Value
Purchase Details
Closed on
Aug 11, 1995
Sold by
Parral Jeronimo Parredes and Parral Maria Rosa
Bought by
Mari Ruben C and Mari Antonia
Purchase Details
Closed on
Mar 15, 1994
Sold by
Mari Roy Ruben C and Mari Antonia B
Bought by
Parral Jeronimo Parredes and Parral Maria Rosalina
Create a Home Valuation Report for This Property
The Home Valuation Report is an in-depth analysis detailing your home's value as well as a comparison with similar homes in the area
Home Values in the Area
Average Home Value in this Area
Purchase History
| Date | Buyer | Sale Price | Title Company |
|---|---|---|---|
| Calderon J Ascencion J | $400,000 | Old Republic Title | |
| Mari Ruben C | -- | -- | |
| Parral Jeronimo Parredes | $97,000 | -- |
Source: Public Records
Tax History Compared to Growth
Tax History
| Year | Tax Paid | Tax Assessment Tax Assessment Total Assessment is a certain percentage of the fair market value that is determined by local assessors to be the total taxable value of land and additions on the property. | Land | Improvement |
|---|---|---|---|---|
| 2025 | $13,773 | $1,082,431 | $870,190 | $212,241 |
| 2024 | $13,773 | $1,061,208 | $853,128 | $208,080 |
| 2023 | $13,517 | $1,040,400 | $836,400 | $204,000 |
| 2022 | $3,487 | $170,477 | $126,451 | $44,026 |
| 2021 | $3,363 | $167,135 | $123,972 | $43,163 |
| 2020 | $3,246 | $165,422 | $122,701 | $42,721 |
| 2019 | $3,153 | $162,180 | $120,296 | $41,884 |
| 2018 | $3,101 | $159,001 | $117,938 | $41,063 |
| 2017 | $3,062 | $155,884 | $115,626 | $40,258 |
| 2016 | $2,923 | $152,828 | $113,359 | $39,469 |
| 2015 | $3,418 | $150,534 | $111,657 | $38,877 |
| 2014 | $3,319 | $147,586 | $109,470 | $38,116 |
Source: Public Records
Map
Nearby Homes
- 1300 E San Antonio St Unit 85
- 1300 E San Antonio St Unit 39
- 1300 E San Antonio St Unit 51
- 1300 E San Antonio St Unit 70
- 1351 Peach Ct Unit 1
- 1340 E William Ct
- 214 S 22nd St
- 445 S 22nd St
- 199 S 23rd St
- 1236 Whitton Ave
- 1248 Whitton Ave
- 987 E William St
- 555 Mclaughlin Ave Unit 42
- 522 S 22nd St
- 180 S 21st St
- 396 S 18th St
- 30 S 22nd St Unit 6
- 289 San Antonio Ct
- 749 Bonita Place
- 758 Bonita Ave
- 1170 Peach Ct
- 1166 Peach Ct
- 352 S 24th St
- 350 S 24th St
- 376 S 24th St
- 304 S 24th St
- 1201 E William Ct
- 1183 William Ct Unit A
- 1201 William Ct
- 1171 William Ct
- 1195 William Ct Unit A
- 398 S 24th St
- 1188 Peach Ct
- 1171 Peach Ct
- 1165 Peach Ct
- 1207 William Ct
- 1205 William Ct
- 1215 William Ct
- 1200 Peach Ct
- 1187 Peach Ct