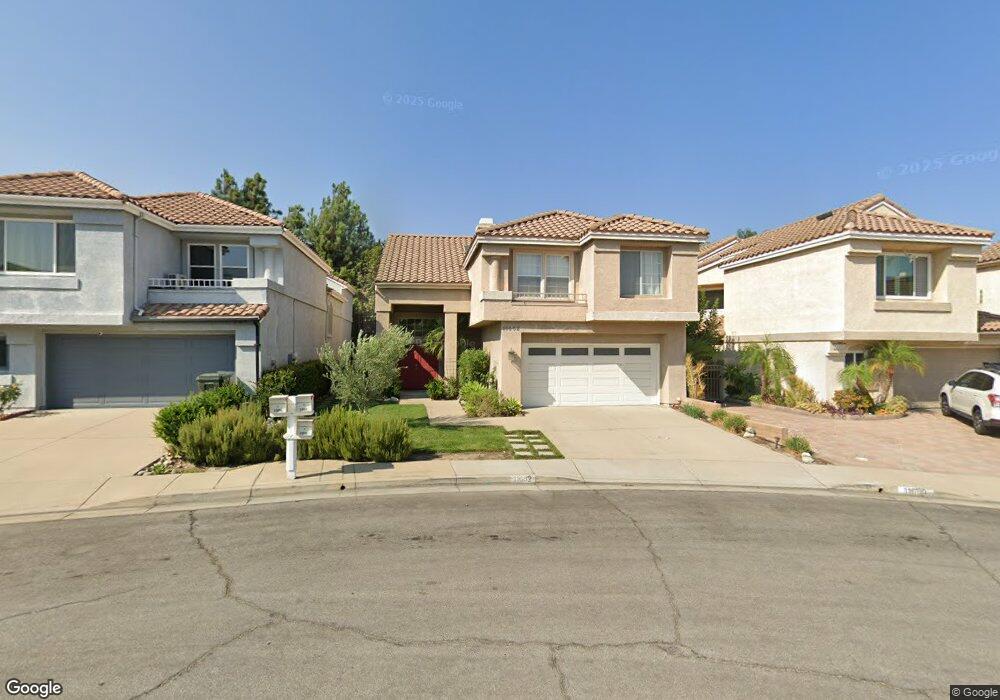
11682 Portofino Dr Rancho Cucamonga, CA 91701
Victoria NeighborhoodEstimated Value: $854,000 - $929,000
3
Beds
3
Baths
2,334
Sq Ft
$381/Sq Ft
Est. Value
About This Home
This home is located at 11682 Portofino Dr, Rancho Cucamonga, CA 91701 and is currently estimated at $890,122, approximately $381 per square foot. 11682 Portofino Dr is a home located in San Bernardino County with nearby schools including Carleton P. Lightfoot Elementary, Day Creek Intermediate, and Rancho Cucamonga High School.
Ownership History
Date
Name
Owned For
Owner Type
Purchase Details
Closed on
May 26, 2021
Sold by
Chaudhry Sabrina
Bought by
Ban Keith and Ban Pui
Current Estimated Value
Home Financials for this Owner
Home Financials are based on the most recent Mortgage that was taken out on this home.
Original Mortgage
$548,250
Interest Rate
2.9%
Mortgage Type
New Conventional
Purchase Details
Closed on
Jan 28, 2011
Sold by
Lindsey Henry
Bought by
Chaudhry Sabrina
Home Financials for this Owner
Home Financials are based on the most recent Mortgage that was taken out on this home.
Original Mortgage
$364,500
Interest Rate
4.79%
Mortgage Type
New Conventional
Purchase Details
Closed on
Dec 10, 1993
Sold by
Lindsey Henry
Bought by
Lindsey Henry and Lindsey Linda
Home Financials for this Owner
Home Financials are based on the most recent Mortgage that was taken out on this home.
Original Mortgage
$206,100
Interest Rate
7.09%
Create a Home Valuation Report for This Property
The Home Valuation Report is an in-depth analysis detailing your home's value as well as a comparison with similar homes in the area
Home Values in the Area
Average Home Value in this Area
Purchase History
| Date | Buyer | Sale Price | Title Company |
|---|---|---|---|
| Ban Keith | $474,500 | Amrock Inc | |
| Chaudhry Sabrina | $405,000 | Chicago Title Company | |
| Chaudhry Sabrina | -- | Chicago Title Company | |
| Lindsey Henry | -- | Stewart Title Co |
Source: Public Records
Mortgage History
| Date | Status | Borrower | Loan Amount |
|---|---|---|---|
| Previous Owner | Ban Keith | $548,250 | |
| Previous Owner | Chaudhry Sabrina | $364,500 | |
| Previous Owner | Lindsey Henry | $206,100 |
Source: Public Records
Tax History Compared to Growth
Tax History
| Year | Tax Paid | Tax Assessment Tax Assessment Total Assessment is a certain percentage of the fair market value that is determined by local assessors to be the total taxable value of land and additions on the property. | Land | Improvement |
|---|---|---|---|---|
| 2025 | $9,143 | $757,703 | $265,196 | $492,507 |
| 2024 | $9,143 | $742,846 | $259,996 | $482,850 |
| 2023 | $8,910 | $759,900 | $265,200 | $494,700 |
| 2022 | $8,789 | $745,000 | $260,000 | $485,000 |
| 2021 | $5,921 | $479,363 | $119,841 | $359,522 |
| 2020 | $5,851 | $474,448 | $118,612 | $355,836 |
| 2019 | $5,706 | $465,145 | $116,286 | $348,859 |
| 2018 | $5,695 | $456,025 | $114,006 | $342,019 |
| 2017 | $5,446 | $447,084 | $111,771 | $335,313 |
| 2016 | $5,297 | $438,317 | $109,579 | $328,738 |
| 2015 | $5,254 | $431,733 | $107,933 | $323,800 |
| 2014 | $5,118 | $423,276 | $105,819 | $317,457 |
Source: Public Records
Map
Nearby Homes
- 6701 Marsala Place
- 6959 Valatta Place
- 6999 Canosa Place
- 11855 Modena Dr
- 6670 Meadowlane Place
- 7070 Pozallo Place
- 6988 Edinburgh Place
- 11854 Novella Ct
- 7139 Scalea Place
- 7116 Sapri Place
- 6530 Catania Place
- 11266 Gannon St
- 11571 Pinnacle Peak Ct
- 11839 Antler Peak Ct
- 7235 Venosa Place
- 11253 Drake St
- 11839 Larino Dr
- 7271 Venosa Place
- 6792 Galveston Place
- 12164 Wembley Ct
- 11690 Portofino Dr
- 11674 Portofino Dr
- 11698 Portofino Dr
- 11666 Portofino Dr
- 11677 Pavia Dr
- 11669 Pavia Dr
- 11685 Pavia Dr
- 6807 Portofino Ct
- 11658 Portofino Dr
- 11661 Pavia Dr
- 11693 Pavia Dr
- 6815 Portofino Ct
- 11691 Portofino Dr
- 11653 Pavia Dr
- 6797 Florence Place
- 11683 Portofino Dr
- 6823 Portofino Ct
- 11675 Portofino Dr
- 11667 Portofino Dr
- 6831 Portofino Ct