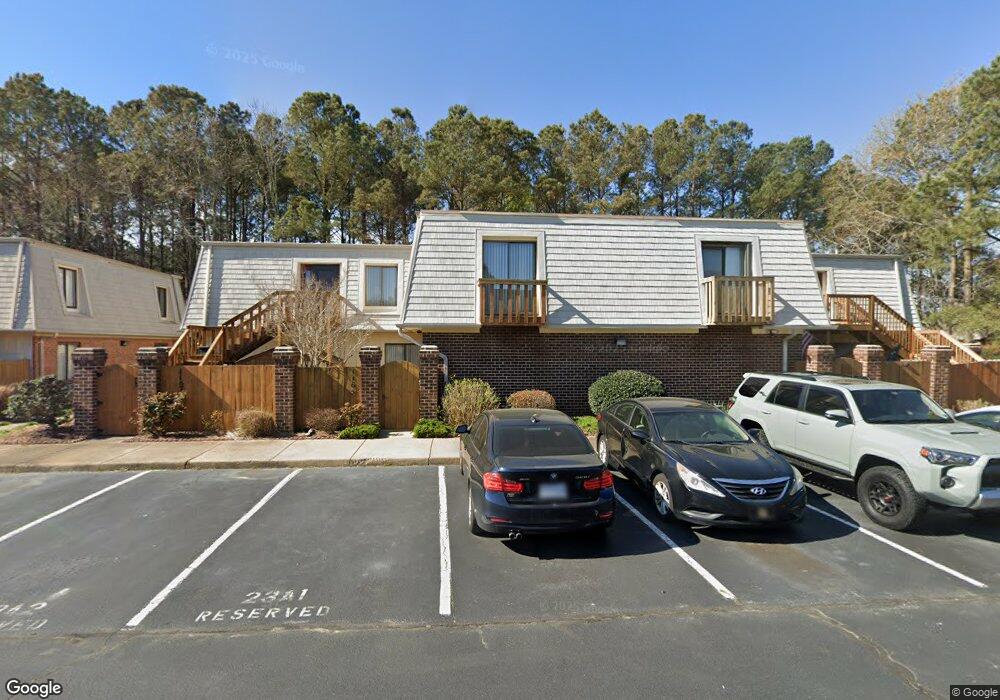
1169 Black Duck Ct Virginia Beach, VA 23451
Shadowlawn NeighborhoodEstimated Value: $273,410 - $286,000
2
Beds
2
Baths
948
Sq Ft
$293/Sq Ft
Est. Value
About This Home
This home is located at 1169 Black Duck Ct, Virginia Beach, VA 23451 and is currently estimated at $277,603, approximately $292 per square foot. 1169 Black Duck Ct is a home located in Virginia Beach City with nearby schools including W.T. Cooke Elementary School, Virginia Beach Middle School, and First Colonial High School.
Ownership History
Date
Name
Owned For
Owner Type
Purchase Details
Closed on
Apr 18, 2013
Sold by
Carson Karen A
Bought by
Minchin Kevin
Current Estimated Value
Home Financials for this Owner
Home Financials are based on the most recent Mortgage that was taken out on this home.
Original Mortgage
$132,300
Outstanding Balance
$93,934
Interest Rate
3.6%
Mortgage Type
New Conventional
Estimated Equity
$183,669
Create a Home Valuation Report for This Property
The Home Valuation Report is an in-depth analysis detailing your home's value as well as a comparison with similar homes in the area
Home Values in the Area
Average Home Value in this Area
Purchase History
| Date | Buyer | Sale Price | Title Company |
|---|---|---|---|
| Minchin Kevin | $147,000 | -- |
Source: Public Records
Mortgage History
| Date | Status | Borrower | Loan Amount |
|---|---|---|---|
| Open | Minchin Kevin | $132,300 |
Source: Public Records
Tax History Compared to Growth
Tax History
| Year | Tax Paid | Tax Assessment Tax Assessment Total Assessment is a certain percentage of the fair market value that is determined by local assessors to be the total taxable value of land and additions on the property. | Land | Improvement |
|---|---|---|---|---|
| 2025 | $2,127 | $237,300 | $95,000 | $142,300 |
| 2024 | $2,127 | $219,300 | $95,000 | $124,300 |
| 2023 | $1,999 | $201,900 | $89,000 | $112,900 |
| 2022 | $1,820 | $183,800 | $75,000 | $108,800 |
| 2021 | $1,649 | $166,600 | $75,000 | $91,600 |
| 2020 | $1,695 | $166,600 | $75,000 | $91,600 |
| 2019 | $1,653 | $149,300 | $67,000 | $82,300 |
| 2018 | $1,497 | $149,300 | $67,000 | $82,300 |
| 2017 | $1,507 | $150,300 | $68,000 | $82,300 |
| 2016 | $1,489 | $150,400 | $69,600 | $80,800 |
| 2015 | $1,419 | $143,300 | $69,600 | $73,700 |
| 2014 | $1,405 | $145,100 | $74,600 | $70,500 |
Source: Public Records
Map
Nearby Homes
- 1132 Ocean Pebbles Way
- 926 13th St
- 1093 Kenya Ln
- 1512 Colonnade Dr
- 1307 Parks Ave
- 729 Virginia Ave Unit X4660
- 1623 Colonnade Crescent Unit X9615
- 1509 Parks Ave
- 731 Carolina Ave
- 1117 Jackson St
- 1207 Cypress Ave
- 722 16th St Unit B
- 726 Carolina Ave
- 309 S Birdneck Rd Unit X9641
- 625 13th St
- 338 Summerville Ct
- 1304 Mediterranean Ave
- 1145 Beautiful St
- 636 Foster Ln
- 538 13th St
- 1173 Black Duck Ct
- 1177 Black Duck Ct
- 1179 Black Duck Ct
- 1165 Black Duck Ct
- 1167 Black Duck Ct
- 1175 Black Duck Ct
- 1175 Black Duck Ct Unit 23B2
- 1157 Black Duck Ct
- 1159 Black Duck Ct
- 1149 Black Duck Ct
- 1153 Black Duck Ct
- 1163 Black Duck Ct
- 403 Canvasback Way
- 1161 Black Duck Ct
- 1151 Black Duck Ct
- 1155 Black Duck Ct
- 405 Canvasback Way
- 404 Canvasback Way
- 402 Canvasback Way
- 400 Canvasback Way