Estimated Value: $421,000 - $686,000
4
Beds
3
Baths
1,874
Sq Ft
$325/Sq Ft
Est. Value
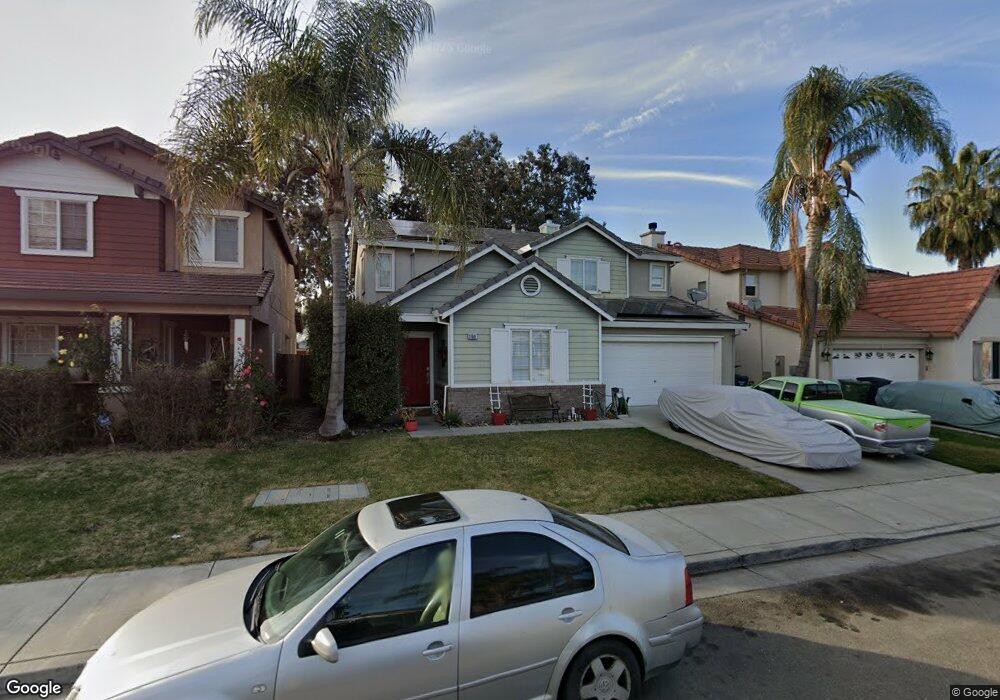
About This Home
This home is located at 1169 Mamie Anderson Ln, Tracy, CA 95377 and is currently estimated at $608,537, approximately $324 per square foot. 1169 Mamie Anderson Ln is a home located in San Joaquin County with nearby schools including Melville S. Jacobson Elementary School, Monte Vista Middle School, and Merrill F. West High School.
Ownership History
Date
Name
Owned For
Owner Type
Purchase Details
Closed on
Jun 19, 2002
Sold by
Washington Sean
Bought by
Garibay Hugo and Santillan Martha
Current Estimated Value
Home Financials for this Owner
Home Financials are based on the most recent Mortgage that was taken out on this home.
Original Mortgage
$251,960
Outstanding Balance
$118,000
Interest Rate
8.35%
Estimated Equity
$490,537
Purchase Details
Closed on
Aug 27, 2001
Sold by
Washington Quwiala
Bought by
Washington Sean
Home Financials for this Owner
Home Financials are based on the most recent Mortgage that was taken out on this home.
Original Mortgage
$264,000
Interest Rate
7.09%
Purchase Details
Closed on
Nov 15, 1999
Sold by
William Lyon Homes Inc
Bought by
Washington Sean
Home Financials for this Owner
Home Financials are based on the most recent Mortgage that was taken out on this home.
Original Mortgage
$177,550
Interest Rate
7.84%
Create a Home Valuation Report for This Property
The Home Valuation Report is an in-depth analysis detailing your home's value as well as a comparison with similar homes in the area
Home Values in the Area
Average Home Value in this Area
Purchase History
| Date | Buyer | Sale Price | Title Company |
|---|---|---|---|
| Garibay Hugo | $315,000 | Financial Title Company | |
| Washington Sean | -- | First American | |
| Washington Sean | $222,000 | Chicago Title Co |
Source: Public Records
Mortgage History
| Date | Status | Borrower | Loan Amount |
|---|---|---|---|
| Open | Garibay Hugo | $251,960 | |
| Previous Owner | Washington Sean | $264,000 | |
| Previous Owner | Washington Sean | $177,550 | |
| Closed | Washington Sean | $33,250 | |
| Closed | Garibay Hugo | $62,990 |
Source: Public Records
Tax History Compared to Growth
Tax History
| Year | Tax Paid | Tax Assessment Tax Assessment Total Assessment is a certain percentage of the fair market value that is determined by local assessors to be the total taxable value of land and additions on the property. | Land | Improvement |
|---|---|---|---|---|
| 2025 | $6,757 | $465,246 | $138,855 | $326,391 |
| 2024 | $6,296 | $456,125 | $136,133 | $319,992 |
| 2023 | $6,188 | $447,182 | $133,464 | $313,718 |
| 2022 | $6,333 | $438,415 | $130,848 | $307,567 |
| 2021 | $6,233 | $429,820 | $128,283 | $301,537 |
| 2020 | $6,173 | $425,414 | $126,968 | $298,446 |
| 2019 | $6,070 | $417,074 | $124,479 | $292,595 |
| 2018 | $5,950 | $408,897 | $122,039 | $286,858 |
| 2017 | $5,694 | $400,881 | $119,647 | $281,234 |
| 2016 | $5,726 | $393,023 | $117,302 | $275,721 |
| 2014 | $5,127 | $354,000 | $106,000 | $248,000 |
Source: Public Records
Map
Nearby Homes
- 2688 W Byron Rd
- 2753 Merchant Ct
- 1214 Dover Ln
- 2750 Shofield Ln Unit 1B
- 1150 Palomar Ct
- 1338 Michael Dr
- 1516 Gentry Ln
- 1677 Green Springs Ct
- 1680 Southbrook St
- 2518 Peppercorn Ln
- 484 Presidio Place
- 2944 Lyon Ct Unit 2B
- 1586 Arrigotti Ln
- 1740 Hampshire Ln
- 2335 Cypress Dr
- 423 Riley Ct
- 2942 Safford Ave
- 1654 Gloria Cir
- 2963 Rugby Ct
- 2001 Bridle Creek Cir
- 1159 Mamie Anderson Ln
- 1179 Mamie Anderson Ln
- 1149 Mamie Anderson Ln
- 1189 Mamie Anderson Ln
- 1180 Berg Rd
- 1139 Mamie Anderson Ln
- 1199 Mamie Anderson Ln
- 1168 Mamie Anderson Ln
- 1178 Mamie Anderson Ln
- 1158 Mamie Anderson Ln
- 1188 Mamie Anderson Ln
- 1148 Mamie Anderson Ln
- 1129 Mamie Anderson Ln
- 1209 Mamie Anderson Ln
- 1138 Mamie Anderson Ln
- 1119 Mamie Anderson Ln
- 2721 Fabian Rd
- 1219 Mamie Anderson Ln
- 1167 Solomon Ct
- 1128 Mamie Anderson Ln