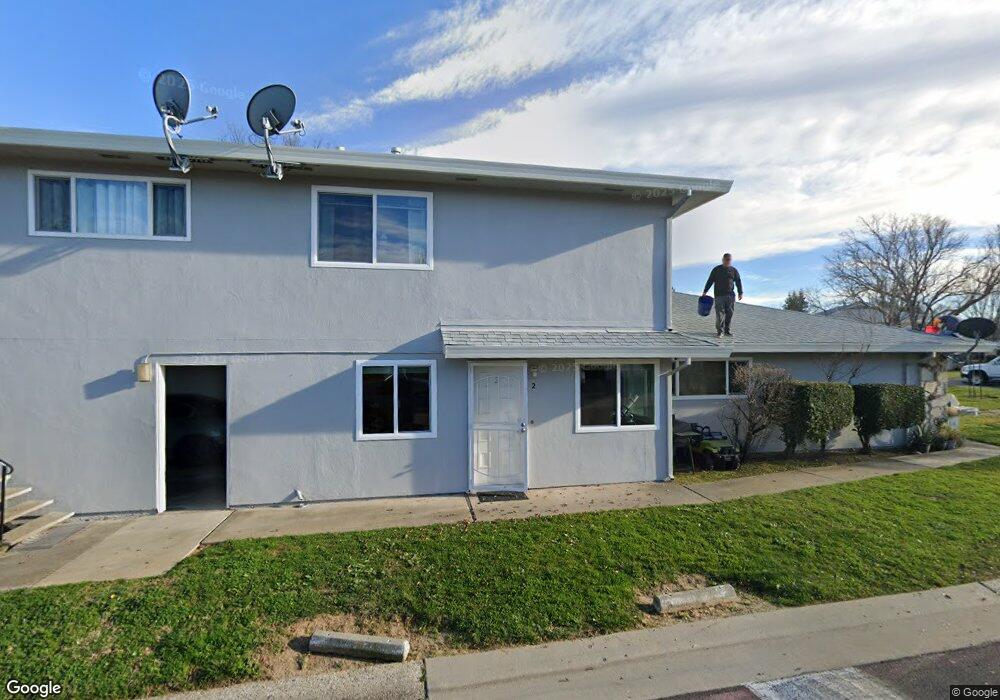
11691 Garnet Way Unit 4 Auburn, CA 95602
Northwest Auburn NeighborhoodEstimated Value: $197,000 - $236,000
2
Beds
1
Bath
840
Sq Ft
$257/Sq Ft
Est. Value
About This Home
This home is located at 11691 Garnet Way Unit 4, Auburn, CA 95602 and is currently estimated at $216,104, approximately $257 per square foot. 11691 Garnet Way Unit 4 is a home located in Placer County with nearby schools including Placer High School, EV Cain Middle, and St. Joseph Catholic School.
Ownership History
Date
Name
Owned For
Owner Type
Purchase Details
Closed on
Sep 27, 2023
Sold by
Popanz Veronica S
Bought by
Murillo Jeanette D and Murillo Jerome K
Current Estimated Value
Home Financials for this Owner
Home Financials are based on the most recent Mortgage that was taken out on this home.
Original Mortgage
$218,250
Outstanding Balance
$214,047
Interest Rate
7.23%
Mortgage Type
New Conventional
Estimated Equity
$2,057
Purchase Details
Closed on
Sep 9, 1998
Sold by
Graves Helen P
Bought by
Popanz Veronica S
Home Financials for this Owner
Home Financials are based on the most recent Mortgage that was taken out on this home.
Original Mortgage
$43,602
Interest Rate
6.92%
Mortgage Type
FHA
Purchase Details
Closed on
Aug 26, 1998
Sold by
Popanz Christopher F
Bought by
Popanz Vernonica S
Home Financials for this Owner
Home Financials are based on the most recent Mortgage that was taken out on this home.
Original Mortgage
$43,602
Interest Rate
6.92%
Mortgage Type
FHA
Purchase Details
Closed on
Jan 29, 1996
Sold by
Graves Helen and Graves Schuyler
Bought by
Graves Helen
Create a Home Valuation Report for This Property
The Home Valuation Report is an in-depth analysis detailing your home's value as well as a comparison with similar homes in the area
Home Values in the Area
Average Home Value in this Area
Purchase History
| Date | Buyer | Sale Price | Title Company |
|---|---|---|---|
| Murillo Jeanette D | $225,000 | Chicago Title | |
| Popanz Veronica S | $45,000 | First American Title Ins Co | |
| Popanz Vernonica S | -- | First American Title Ins Co | |
| Graves Helen | -- | -- |
Source: Public Records
Mortgage History
| Date | Status | Borrower | Loan Amount |
|---|---|---|---|
| Open | Murillo Jeanette D | $218,250 | |
| Previous Owner | Popanz Veronica S | $43,602 |
Source: Public Records
Tax History Compared to Growth
Tax History
| Year | Tax Paid | Tax Assessment Tax Assessment Total Assessment is a certain percentage of the fair market value that is determined by local assessors to be the total taxable value of land and additions on the property. | Land | Improvement |
|---|---|---|---|---|
| 2025 | $3,368 | $229,500 | $10,200 | $219,300 |
| 2023 | $3,368 | $67,706 | $27,079 | $40,627 |
| 2022 | $1,602 | $66,380 | $26,549 | $39,831 |
| 2021 | $1,576 | $65,079 | $26,029 | $39,050 |
| 2020 | $1,571 | $64,413 | $25,763 | $38,650 |
| 2019 | $1,558 | $63,151 | $25,258 | $37,893 |
| 2018 | $1,521 | $61,913 | $24,763 | $37,150 |
| 2017 | $1,509 | $60,700 | $24,278 | $36,422 |
| 2016 | $1,496 | $59,510 | $23,802 | $35,708 |
| 2015 | $1,480 | $58,617 | $23,445 | $35,172 |
| 2014 | $1,471 | $57,470 | $22,986 | $34,484 |
Source: Public Records
Map
Nearby Homes
- 11670 Garnet Way Unit 4
- 11632 Quartz Dr Unit 4
- 11582 Quartz Dr Unit 3
- 3677 Galena Dr Unit 3
- 11521 Garnet Way Unit 2
- 11510 Garnet Way Unit 4
- 3643 Galena Dr Unit 4
- 3681 Galena Dr Unit 4
- 3277 Professional Dr
- 3222 Fortune Ct
- 3765 Grass Valley Hwy Unit 282
- 3765 Grass Valley Hwy Unit 263
- 3765 Grass Valley Hwy Unit 14
- 3765 Grass Valley Hwy Unit 117
- 3765 Grass Valley Hwy Unit 226
- 0 Bell Rd Unit 225114567
- 11325 Tahoe St
- 2059 Bell Rd
- 2690 Commons Place
- 2660 Commons Place
- 11691 Garnet Way
- 11691 Garnet Way Unit 2
- 11691 Garnet Way Unit 1
- 11691 Garnet Way
- 11701 Garnet Way Unit 3
- 11701 Garnet Way Unit 2
- 11701 Garnet Way
- 11701 Garnet Way
- 3572 Opal Dr Unit 2
- 3572 Opal Dr
- 3572 Opal Dr Unit 3
- 3572 Opal Dr Unit 1
- 3572 Opal Dr Unit 1
- 3572 Opal Dr Unit 4
- 3562 Opal Dr Unit 3
- 3562 Opal Dr Unit 2
- 3562 Opal Dr Unit 1
- 3562 Opal Dr Unit 4
- 11710 Garnet Way Unit 3
- 11710 Garnet Way Unit 2