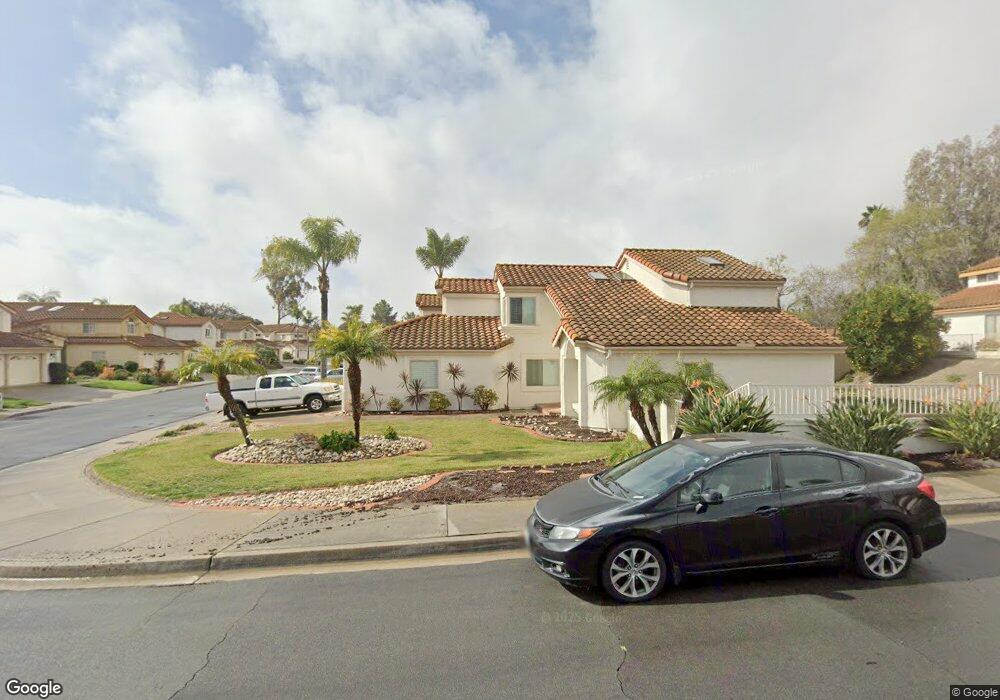
11698 Via Firul San Diego, CA 92128
Rancho Bernardo NeighborhoodEstimated Value: $1,310,000 - $1,455,000
4
Beds
3
Baths
2,041
Sq Ft
$669/Sq Ft
Est. Value
About This Home
This home is located at 11698 Via Firul, San Diego, CA 92128 and is currently estimated at $1,366,171, approximately $669 per square foot. 11698 Via Firul is a home located in San Diego County with nearby schools including Highland Ranch Elementary School, Bernardo Heights Middle, and Rancho Bernardo High.
Ownership History
Date
Name
Owned For
Owner Type
Purchase Details
Closed on
May 9, 2019
Sold by
Thomson Pamella D
Bought by
The Pamella D Thomson Family Trust
Current Estimated Value
Purchase Details
Closed on
May 22, 2009
Sold by
Thomson Ronald C and Thomson Pamella D
Bought by
Thomson Ronald C and Thomson Pamella D
Home Financials for this Owner
Home Financials are based on the most recent Mortgage that was taken out on this home.
Original Mortgage
$377,400
Outstanding Balance
$241,515
Interest Rate
5.09%
Mortgage Type
Stand Alone Refi Refinance Of Original Loan
Estimated Equity
$1,124,656
Purchase Details
Closed on
Aug 7, 2007
Sold by
Thomson Ronald C and Thomson Pamella D
Bought by
Thomson Ronald C and Thomson Pamella D
Purchase Details
Closed on
Feb 27, 1987
Create a Home Valuation Report for This Property
The Home Valuation Report is an in-depth analysis detailing your home's value as well as a comparison with similar homes in the area
Home Values in the Area
Average Home Value in this Area
Purchase History
| Date | Buyer | Sale Price | Title Company |
|---|---|---|---|
| The Pamella D Thomson Family Trust | -- | None Available | |
| Thomson Pamella D | -- | None Available | |
| Thomson Ronald C | -- | None Available | |
| Thomson Ronald C | -- | None Available | |
| Thomson Ronald C | -- | None Available | |
| -- | $170,000 | -- |
Source: Public Records
Mortgage History
| Date | Status | Borrower | Loan Amount |
|---|---|---|---|
| Open | Thomson Ronald C | $377,400 |
Source: Public Records
Tax History Compared to Growth
Tax History
| Year | Tax Paid | Tax Assessment Tax Assessment Total Assessment is a certain percentage of the fair market value that is determined by local assessors to be the total taxable value of land and additions on the property. | Land | Improvement |
|---|---|---|---|---|
| 2025 | $3,618 | $331,841 | $139,891 | $191,950 |
| 2024 | $3,618 | $325,336 | $137,149 | $188,187 |
| 2023 | $3,539 | $318,958 | $134,460 | $184,498 |
| 2022 | $3,479 | $312,705 | $131,824 | $180,881 |
| 2021 | $3,432 | $306,575 | $129,240 | $177,335 |
| 2020 | $3,385 | $303,432 | $127,915 | $175,517 |
| 2019 | $3,296 | $297,483 | $125,407 | $172,076 |
| 2018 | $3,202 | $291,651 | $122,949 | $168,702 |
| 2017 | $3,115 | $285,934 | $120,539 | $165,395 |
| 2016 | $3,049 | $280,328 | $118,176 | $162,152 |
| 2015 | $3,002 | $276,118 | $116,401 | $159,717 |
| 2014 | $2,931 | $270,710 | $114,121 | $156,589 |
Source: Public Records
Map
Nearby Homes
- 12007 Alta Carmel Ct Unit 325
- 12055 Alta Carmel Ct Unit 185
- 12015 Alta Carmel Ct Unit 299
- 12059 Alta Carmel Ct Unit 167
- 12047 Alta Carmel Ct Unit 189
- 15389 Avenida Rorras
- 15048 Avenida Venusto Unit 260
- 12152 Royal Birkdale Row Unit B
- 15032 Avenida Venusto Unit 179
- 12122 Royal Birkdale Row Unit 403
- 12132 Royal Birkdale Row Unit 303 E
- 12132 Royal Birkdale Row
- 11705 Via Medanos
- 11385 Paseo Albacete
- 11378 Ajanta Ct
- 15541 Paseo Jenghiz
- 15662 Via Calanova
- 15547 Paseo Jenghiz
- 12290 Corte Sabio Unit 3101
- 15576 Paseo Ajanta
- 11690 Via Firul
- 12063 Avenida Sivrita
- 11682 Via Firul
- 12070 Avenida Sivrita
- 12064 Avenida Sivrita
- 12049 Avenida Sivrita
- 12078 Avenida Sivrita
- 12056 Avenida Sivrita
- 11697 Via Firul
- 11691 Via Firul
- 11672 Via Firul
- 11652 Via Firul
- 12571 Cmto de La Gallarda
- 18741 Cmto Pasadero #100
- 11887 Cmto de Las Missiones
- 12510 Camto de La Gallarda
- 11863 Cmto de Las Missiones
- 11791 Cmt de Las Missiones
- 11685 Via Firul
- 12088 Avenida Sivrita