117 29th St N Battle Creek, MI 49015
Westlake Prairieview NeighborhoodEstimated Value: $157,973 - $196,000
3
Beds
2
Baths
1,206
Sq Ft
$141/Sq Ft
Est. Value
About This Home
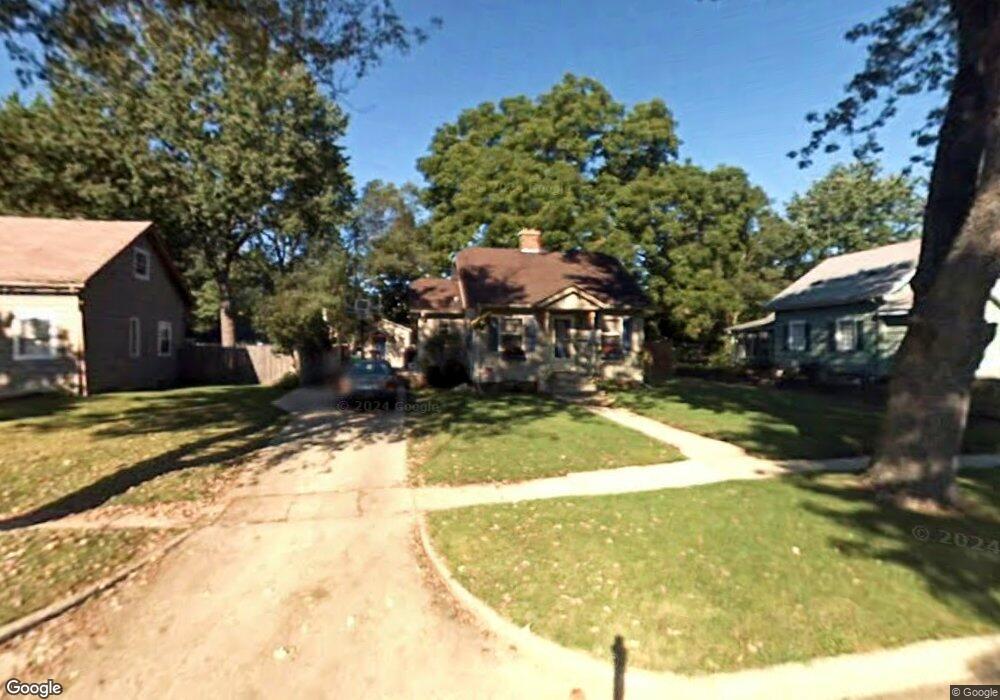
This home is located at 117 29th St N, Battle Creek, MI 49015 and is currently estimated at $170,243, approximately $141 per square foot. 117 29th St N is a home located in Calhoun County with nearby schools including Lakeview Middle School, Lakeview High School, and Battle Creek Montessori Academy.
Ownership History
Date
Name
Owned For
Owner Type
Purchase Details
Closed on
Nov 15, 2013
Sold by
Chester Scott A
Bought by
Chester Judith L
Current Estimated Value
Purchase Details
Closed on
Apr 30, 2002
Bought by
Chester Scott A and Chester Judith L
Purchase Details
Closed on
Jun 25, 1998
Bought by
Thurtle
Purchase Details
Closed on
Jun 19, 1997
Sold by
Thomason-Mc Cleary
Bought by
Orns
Purchase Details
Closed on
Jun 9, 1997
Sold by
Mccleary Brian L
Bought by
Thomason Mc Cleary Susan D
Create a Home Valuation Report for This Property
The Home Valuation Report is an in-depth analysis detailing your home's value as well as a comparison with similar homes in the area
Home Values in the Area
Average Home Value in this Area
Purchase History
| Date | Buyer | Sale Price | Title Company |
|---|---|---|---|
| Chester Judith L | -- | Atty Title | |
| Chester Scott A | -- | -- | |
| Thurtle | $72,000 | -- | |
| Orns | $63,000 | -- | |
| Thomason Mc Cleary Susan D | -- | -- |
Source: Public Records
Tax History Compared to Growth
Tax History
| Year | Tax Paid | Tax Assessment Tax Assessment Total Assessment is a certain percentage of the fair market value that is determined by local assessors to be the total taxable value of land and additions on the property. | Land | Improvement |
|---|---|---|---|---|
| 2025 | -- | $65,400 | $0 | $0 |
| 2024 | $1,247 | $59,283 | $0 | $0 |
| 2023 | $1,419 | $51,995 | $0 | $0 |
| 2022 | $1,126 | $40,894 | $0 | $0 |
| 2021 | $1,383 | $38,206 | $0 | $0 |
| 2020 | $1,368 | $39,039 | $0 | $0 |
| 2019 | $1,295 | $35,276 | $0 | $0 |
| 2018 | $1,295 | $31,699 | $2,920 | $28,779 |
| 2017 | $1,256 | $29,297 | $0 | $0 |
| 2016 | $1,254 | $28,097 | $0 | $0 |
| 2015 | $1,167 | $26,925 | $2,948 | $23,977 |
| 2014 | $1,167 | $26,083 | $2,948 | $23,135 |
Source: Public Records
Map
Nearby Homes