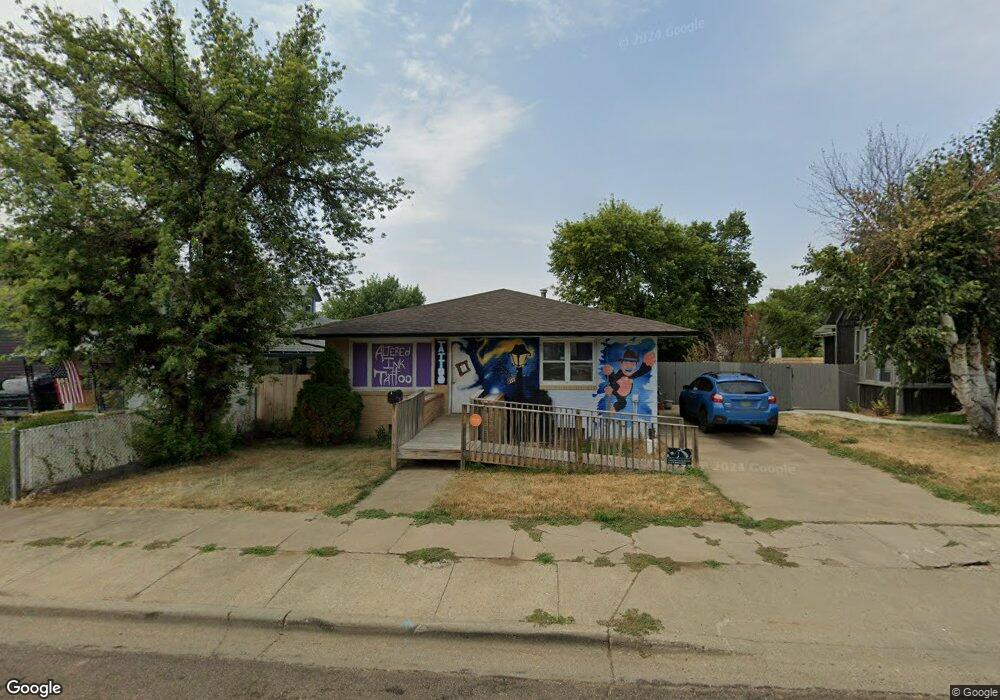
117 2nd Ave E Dickinson, ND 58601
Estimated Value: $278,000 - $295,937
3
Beds
2
Baths
1,380
Sq Ft
$209/Sq Ft
Est. Value
About This Home
This home is located at 117 2nd Ave E, Dickinson, ND 58601 and is currently estimated at $288,646, approximately $209 per square foot. 117 2nd Ave E is a home located in Stark County with nearby schools including Trinity Elementary School West, Trinity Elementary School East, and St. Joseph School.
Ownership History
Date
Name
Owned For
Owner Type
Purchase Details
Closed on
Nov 8, 2022
Sold by
Fisher James and Fisher Mary
Bought by
Sandala Joshua and Sandala Kelsea
Current Estimated Value
Home Financials for this Owner
Home Financials are based on the most recent Mortgage that was taken out on this home.
Original Mortgage
$180,000
Outstanding Balance
$70,190
Interest Rate
6.94%
Mortgage Type
New Conventional
Estimated Equity
$218,456
Purchase Details
Closed on
May 12, 2003
Sold by
Pflepsen Gloria D and Prociv Gloria D
Bought by
Prociv Randall M
Home Financials for this Owner
Home Financials are based on the most recent Mortgage that was taken out on this home.
Original Mortgage
$91,000
Interest Rate
8.3%
Mortgage Type
Adjustable Rate Mortgage/ARM
Create a Home Valuation Report for This Property
The Home Valuation Report is an in-depth analysis detailing your home's value as well as a comparison with similar homes in the area
Home Values in the Area
Average Home Value in this Area
Purchase History
| Date | Buyer | Sale Price | Title Company |
|---|---|---|---|
| Sandala Joshua | -- | The Title Team | |
| Prociv Randall M | -- | None Available |
Source: Public Records
Mortgage History
| Date | Status | Borrower | Loan Amount |
|---|---|---|---|
| Open | Sandala Joshua | $180,000 | |
| Previous Owner | Prociv Randall M | $91,000 |
Source: Public Records
Tax History
| Year | Tax Paid | Tax Assessment Tax Assessment Total Assessment is a certain percentage of the fair market value that is determined by local assessors to be the total taxable value of land and additions on the property. | Land | Improvement |
|---|---|---|---|---|
| 2025 | $2,998 | $217,800 | $21,500 | $196,300 |
| 2024 | $3,177 | $217,800 | $21,500 | $196,300 |
| 2023 | $2,387 | $217,800 | $21,500 | $196,300 |
| 2021 | $2,120 | $206,100 | $21,500 | $184,600 |
| 2020 | $2,149 | $206,100 | $21,500 | $184,600 |
| 2019 | $2,155 | $206,100 | $21,500 | $184,600 |
| 2017 | $1,811 | $215,800 | $21,500 | $194,300 |
| 2015 | $1,811 | $206,900 | $12,400 | $194,500 |
| 2014 | $1,905 | $201,500 | $12,400 | $189,100 |
| 2013 | -- | $194,800 | $12,400 | $182,400 |
Source: Public Records
Map
Nearby Homes
Your Personal Tour Guide
Ask me questions while you tour the home.