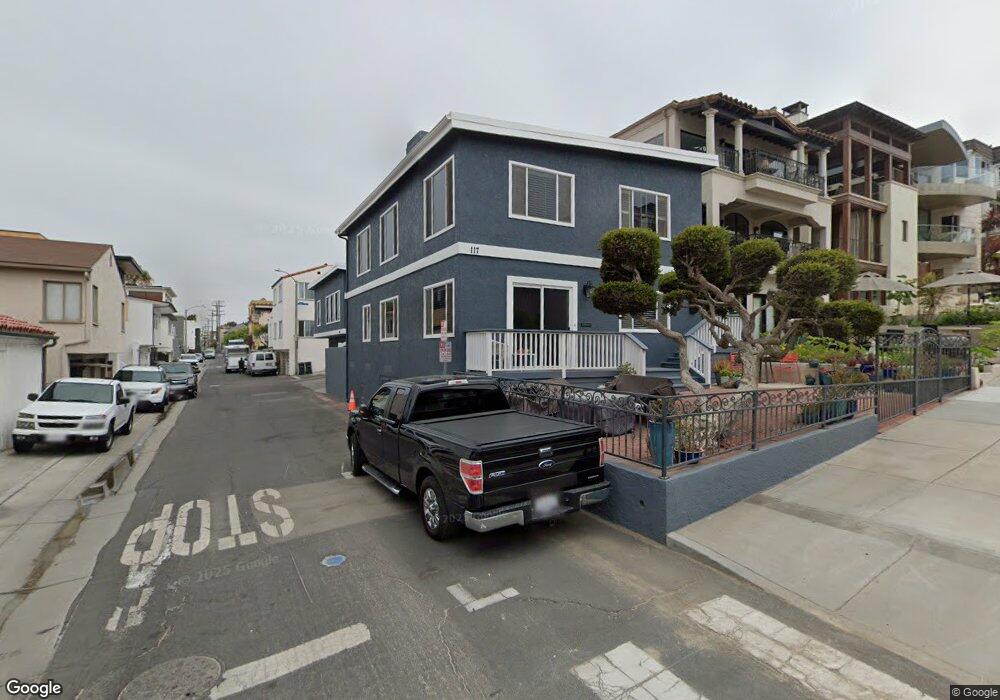
117 6th St Manhattan Beach, CA 90266
Estimated Value: $5,351,000 - $5,872,000
5
Beds
3
Baths
2,562
Sq Ft
$2,190/Sq Ft
Est. Value
About This Home
This home is located at 117 6th St, Manhattan Beach, CA 90266 and is currently estimated at $5,611,500, approximately $2,190 per square foot. 117 6th St is a home located in Los Angeles County with nearby schools including Opal Robinson Elementary School, Manhattan Beach Middle School, and Mira Costa High School.
Ownership History
Date
Name
Owned For
Owner Type
Purchase Details
Closed on
Jul 24, 2013
Sold by
Amezcua Richard D
Bought by
Amezcua Richard D and Richard A Amezcua Revocable Tr
Current Estimated Value
Create a Home Valuation Report for This Property
The Home Valuation Report is an in-depth analysis detailing your home's value as well as a comparison with similar homes in the area
Home Values in the Area
Average Home Value in this Area
Purchase History
| Date | Buyer | Sale Price | Title Company |
|---|---|---|---|
| Amezcua Richard D | -- | None Available |
Source: Public Records
Tax History
| Year | Tax Paid | Tax Assessment Tax Assessment Total Assessment is a certain percentage of the fair market value that is determined by local assessors to be the total taxable value of land and additions on the property. | Land | Improvement |
|---|---|---|---|---|
| 2025 | $65,506 | $5,905,686 | $5,796,323 | $109,363 |
| 2024 | $65,506 | $5,789,889 | $5,682,670 | $107,219 |
| 2023 | $63,869 | $5,676,363 | $5,571,246 | $105,117 |
| 2022 | $62,756 | $5,565,062 | $5,462,006 | $103,056 |
| 2021 | $61,627 | $5,455,944 | $5,354,908 | $101,036 |
| 2020 | $3,058 | $209,233 | $135,159 | $74,074 |
| 2019 | $3,012 | $205,151 | $132,509 | $72,642 |
| 2018 | $2,928 | $201,149 | $129,911 | $71,238 |
| 2016 | $2,493 | $192,360 | $124,867 | $67,493 |
| 2015 | $2,446 | $189,472 | $122,992 | $66,480 |
| 2014 | $2,435 | $185,761 | $120,583 | $65,178 |
Source: Public Records
Map
Nearby Homes
- 920 The Strand
- 212 Manhattan Ave
- 1000 The Strand
- 124 11th St
- 337 10th St
- 89 Bayview Dr
- 98 Highland Ave
- 436 1st St
- 621 6th St
- 1304 The Strand Unit A
- 231 Longfellow Ave
- 525 Manhattan Beach Blvd
- 1140 Fisher Ave
- 521 13th St
- 137 15th St
- 628 13th St
- 121 16th St
- 215 S Poinsettia Ave
- 642 14th St
- 324 18th St
Your Personal Tour Guide
Ask me questions while you tour the home.