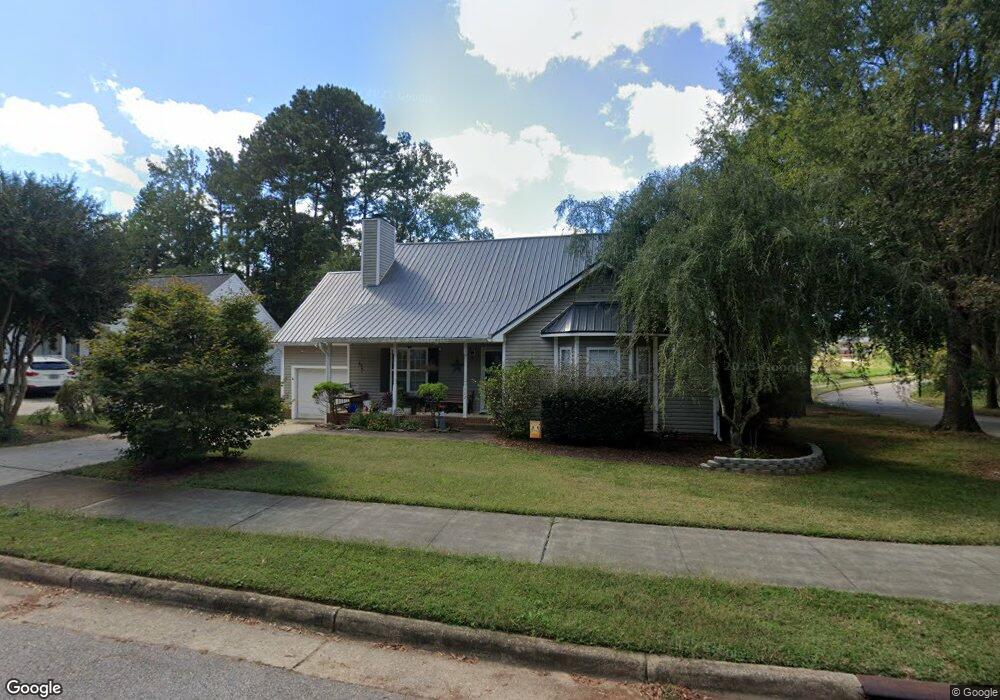
117 Alberbury Commons Ct Wake Forest, NC 27587
Estimated Value: $342,000 - $370,000
3
Beds
3
Baths
1,346
Sq Ft
$268/Sq Ft
Est. Value
About This Home
This home is located at 117 Alberbury Commons Ct, Wake Forest, NC 27587 and is currently estimated at $360,327, approximately $267 per square foot. 117 Alberbury Commons Ct is a home located in Wake County with nearby schools including Forest Pines Drive Elementary School, Wake Forest-Rolesville Middle School, and Heritage High School.
Ownership History
Date
Name
Owned For
Owner Type
Purchase Details
Closed on
Aug 24, 2016
Sold by
Mcginley Kevin B and Mcginley Kara E
Bought by
Tolentino Lindsey R and Tolentino Celestino
Current Estimated Value
Home Financials for this Owner
Home Financials are based on the most recent Mortgage that was taken out on this home.
Original Mortgage
$162,960
Outstanding Balance
$129,771
Interest Rate
3.42%
Mortgage Type
New Conventional
Estimated Equity
$230,556
Purchase Details
Closed on
Dec 16, 1997
Sold by
T L C Builders Inc
Bought by
Mcginley Kevin B and Mcginley Kara E
Home Financials for this Owner
Home Financials are based on the most recent Mortgage that was taken out on this home.
Original Mortgage
$124,900
Interest Rate
7.18%
Create a Home Valuation Report for This Property
The Home Valuation Report is an in-depth analysis detailing your home's value as well as a comparison with similar homes in the area
Home Values in the Area
Average Home Value in this Area
Purchase History
| Date | Buyer | Sale Price | Title Company |
|---|---|---|---|
| Tolentino Lindsey R | $168,000 | None Available | |
| Mcginley Kevin B | $125,000 | -- |
Source: Public Records
Mortgage History
| Date | Status | Borrower | Loan Amount |
|---|---|---|---|
| Open | Tolentino Lindsey R | $162,960 | |
| Previous Owner | Mcginley Kevin B | $124,900 |
Source: Public Records
Tax History Compared to Growth
Tax History
| Year | Tax Paid | Tax Assessment Tax Assessment Total Assessment is a certain percentage of the fair market value that is determined by local assessors to be the total taxable value of land and additions on the property. | Land | Improvement |
|---|---|---|---|---|
| 2025 | $3,494 | $357,754 | $80,000 | $277,754 |
| 2024 | $3,481 | $357,754 | $80,000 | $277,754 |
| 2023 | $2,532 | $216,198 | $40,000 | $176,198 |
| 2022 | $2,430 | $216,198 | $40,000 | $176,198 |
| 2021 | $2,387 | $216,198 | $40,000 | $176,198 |
| 2020 | $2,381 | $215,618 | $40,000 | $175,618 |
| 2019 | $2,108 | $168,328 | $38,000 | $130,328 |
| 2018 | $1,997 | $168,328 | $38,000 | $130,328 |
| 2017 | $1,931 | $168,328 | $38,000 | $130,328 |
| 2016 | $1,906 | $168,328 | $38,000 | $130,328 |
| 2015 | $1,946 | $169,761 | $38,000 | $131,761 |
| 2014 | $1,884 | $169,761 | $38,000 | $131,761 |
Source: Public Records
Map
Nearby Homes
- 122 Alberbury Commons Ct
- 1758 Rowsby Ct
- 1446 Cimarron Pkwy Unit 64
- 1454 Cimarron Pkwy
- 3333 Mountain Hill Dr
- 672 Millers Mark Ave
- 1413 Cedar Branch Ct
- 0 S Main St
- 403 Belgian Red Way
- 407 Belgian Red Way
- 409 Belgian Red Way
- 415 Belgian Red Way
- 417 Belgian Red Way
- 413 Belgian Red Way
- 420 Belgian Red Way
- 425 Belgian Red Way
- 1451 Cimarron Pkwy
- 10016 Porto Fino Ave
- 11710 Mezzanine Dr Unit 111
- 936 Blue Bird Ln
- 113 Alberbury Commons Ct
- 201 Alberbury Commons Ct
- 109 Alberbury Commons Ct
- 118 Alberbury Commons Ct
- 114 Alberbury Commons Ct
- 202 Alberbury Commons Ct
- 205 Alberbury Commons Ct
- 105 Alberbury Commons Ct
- 110 Alberbury Commons Ct
- 206 Alberbury Commons Ct
- 106 Alberbury Commons Ct
- 209 Alberbury Commons Ct
- 101 Alberbury Commons Ct
- 210 Alberbury Commons Ct
- 1890 S Main St
- 1890 S Main St Unit Ste 100
- 1890 S Main St Unit 102
- 1890 S Main St Unit 104
- 102 Alberbury Commons Ct
- 213 Alberbury Commons Ct