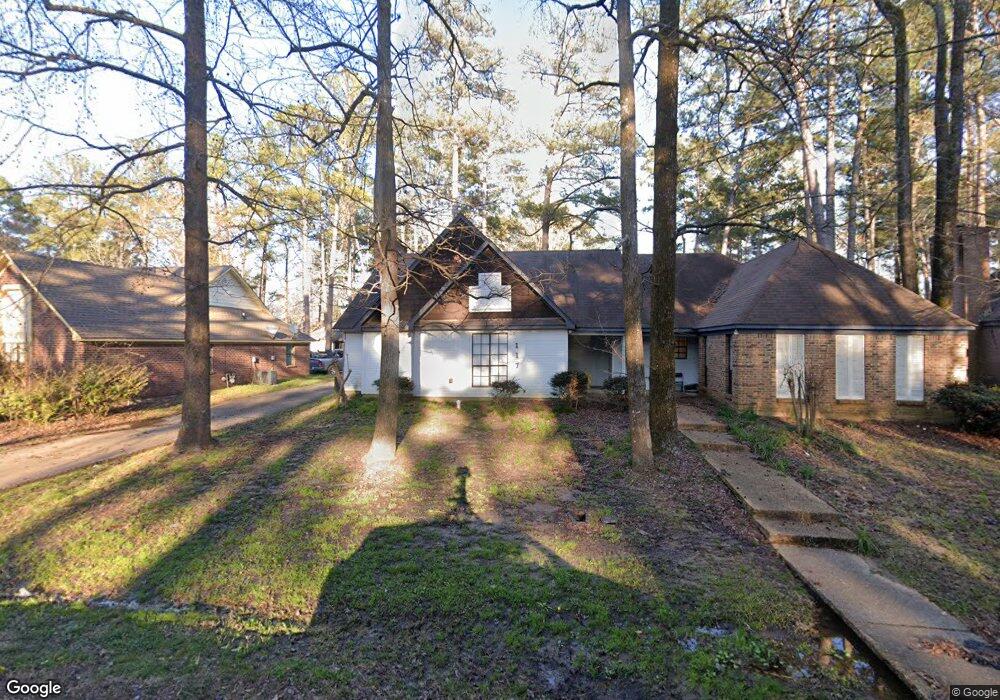
117 Bent Creek Cir N Brandon, MS 39047
Estimated Value: $138,000 - $217,000
3
Beds
1
Bath
1,158
Sq Ft
$157/Sq Ft
Est. Value
About This Home
This home is located at 117 Bent Creek Cir N, Brandon, MS 39047 and is currently estimated at $181,660, approximately $156 per square foot. 117 Bent Creek Cir N is a home located in Rankin County with nearby schools including Highland Bluff Elementary School, Northwest Rankin Middle School, and Northwest Rankin High School.
Ownership History
Date
Name
Owned For
Owner Type
Purchase Details
Closed on
May 20, 2024
Sold by
Petes Enterprises Llc
Bought by
Williamson Parish and Williamson Qianwen
Current Estimated Value
Home Financials for this Owner
Home Financials are based on the most recent Mortgage that was taken out on this home.
Original Mortgage
$206,250
Outstanding Balance
$203,325
Interest Rate
6.82%
Mortgage Type
New Conventional
Estimated Equity
-$21,665
Purchase Details
Closed on
May 16, 2024
Sold by
Petes Enterprises Llc
Bought by
Petes Enterprises Llc
Home Financials for this Owner
Home Financials are based on the most recent Mortgage that was taken out on this home.
Original Mortgage
$206,250
Outstanding Balance
$203,325
Interest Rate
6.82%
Mortgage Type
New Conventional
Estimated Equity
-$21,665
Purchase Details
Closed on
Aug 26, 2009
Sold by
Wade E Wade E and Blauche Virginia B
Bought by
Gualano Ernest and Gualano Charla P
Create a Home Valuation Report for This Property
The Home Valuation Report is an in-depth analysis detailing your home's value as well as a comparison with similar homes in the area
Home Values in the Area
Average Home Value in this Area
Purchase History
| Date | Buyer | Sale Price | Title Company |
|---|---|---|---|
| Williamson Parish | -- | None Listed On Document | |
| Petes Enterprises Llc | -- | None Listed On Document | |
| Gualano Ernest | -- | -- |
Source: Public Records
Mortgage History
| Date | Status | Borrower | Loan Amount |
|---|---|---|---|
| Open | Williamson Parish | $206,250 |
Source: Public Records
Tax History Compared to Growth
Tax History
| Year | Tax Paid | Tax Assessment Tax Assessment Total Assessment is a certain percentage of the fair market value that is determined by local assessors to be the total taxable value of land and additions on the property. | Land | Improvement |
|---|---|---|---|---|
| 2024 | $1,354 | $12,573 | $0 | $0 |
| 2023 | $1,140 | $10,583 | $0 | $0 |
| 2022 | $1,124 | $10,583 | $0 | $0 |
| 2021 | $1,124 | $10,583 | $0 | $0 |
| 2020 | $1,124 | $10,583 | $0 | $0 |
| 2019 | $1,030 | $9,449 | $0 | $0 |
| 2018 | $1,011 | $9,449 | $0 | $0 |
| 2017 | $1,011 | $9,449 | $0 | $0 |
| 2016 | $929 | $9,114 | $0 | $0 |
| 2015 | $929 | $9,114 | $0 | $0 |
| 2014 | $910 | $9,114 | $0 | $0 |
| 2013 | $910 | $9,114 | $0 | $0 |
Source: Public Records
Map
Nearby Homes
- 111 Bent Creek Cir N Unit B
- 111 Shenandoah Rd N
- 101 Dogwood Cir
- 104 Holly Trail
- 1808 Spillway Rd
- 191 Bellegrove Cir
- 173b Cumberland Rd
- 103 Forest Point Dr
- 173 Fallen Oaks Dr
- 126 Plum Tree Rd
- 0 Arrowhead Trail Unit 4081131
- 154 Cumberland Rd
- 109 Brandy Run Rd
- 105 Poplar Dr
- 112 Wildwood Ln
- 111 Arrowhead Trail
- 169 Bellegrove Cir
- 318 Turtle Hollow
- 126 Turtle Ridge Dr
- 119 Turtle Ridge Dr
- 117 Bent Creek Cir N
- 117 Bent Creek Cir N Unit B
- 117 Bent Creek Cir N Unit A
- 115 B N B Bent Creek Cir Unit B
- 119 Bent Creek Cir N
- 119 Bent Creek Cir N
- 115 Bent Creek Cir N
- 115 Bent Creek Cir N Unit A
- 115 Bent Creek Cir N Unit B
- 115 B Bent Creek Cir Unit B
- 114 Fairfax Cir
- 114 Fairfax Cir
- 114 Fairfax Cir Unit A
- 114 Fairfax Cir Unit B
- 116 Fairfax Cir
- 116 Fairfax Cir
- 118 Fairfax Cir
- 118 Fairfax Cir
- 118 Fairfax Cir Unit B
- 118 Fairfax Cir