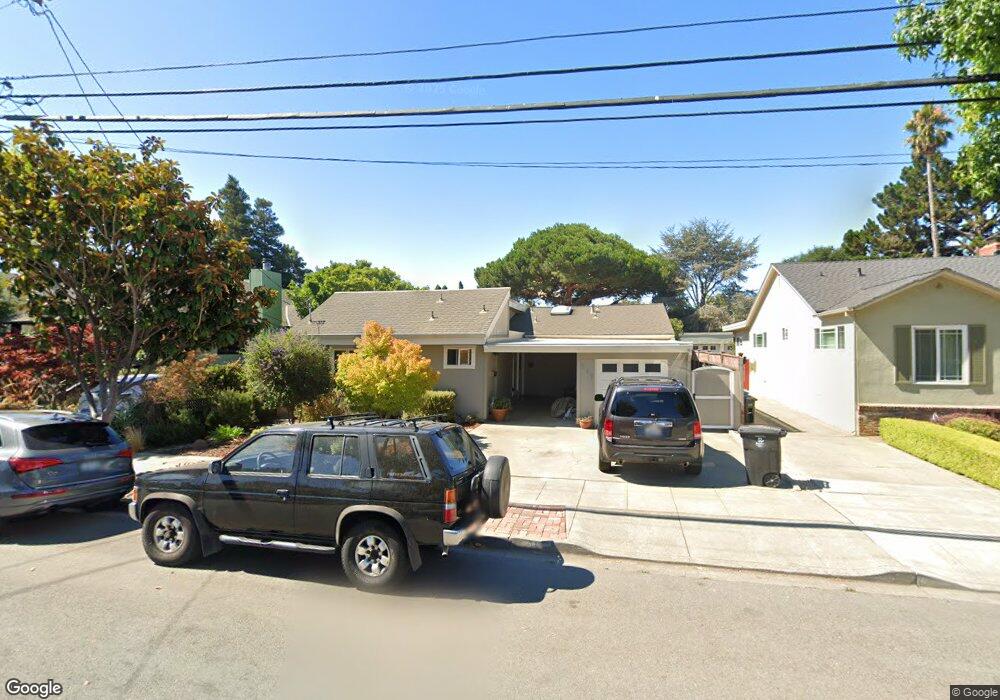
117 Bloomfield Rd Burlingame, CA 94010
Lyon Hoag NeighborhoodEstimated Value: $2,282,000 - $3,460,000
4
Beds
3
Baths
2,040
Sq Ft
$1,408/Sq Ft
Est. Value
About This Home
This home is located at 117 Bloomfield Rd, Burlingame, CA 94010 and is currently estimated at $2,872,165, approximately $1,407 per square foot. 117 Bloomfield Rd is a home located in San Mateo County with nearby schools including Washington Elementary School, Burlingame Intermediate School, and Burlingame High School.
Ownership History
Date
Name
Owned For
Owner Type
Purchase Details
Closed on
Mar 10, 2009
Sold by
Gabler Ser M
Bought by
Gabler Ser M
Current Estimated Value
Purchase Details
Closed on
Dec 2, 2008
Sold by
Gabler Ser M
Bought by
Gabler David S and Gabler Ser M
Purchase Details
Closed on
Jan 6, 2006
Sold by
Brookins Ser M
Bought by
Brookins Ser M
Purchase Details
Closed on
Feb 24, 2005
Sold by
Brookins June
Bought by
Brookins Ser M
Purchase Details
Closed on
Oct 14, 1997
Sold by
June Brookins and Lehmenn Elfriede C
Bought by
Brookins June
Home Financials for this Owner
Home Financials are based on the most recent Mortgage that was taken out on this home.
Original Mortgage
$105,000
Outstanding Balance
$16,929
Interest Rate
7.49%
Estimated Equity
$2,855,236
Create a Home Valuation Report for This Property
The Home Valuation Report is an in-depth analysis detailing your home's value as well as a comparison with similar homes in the area
Home Values in the Area
Average Home Value in this Area
Purchase History
| Date | Buyer | Sale Price | Title Company |
|---|---|---|---|
| Gabler Ser M | -- | None Available | |
| Gabler Ser M | -- | None Available | |
| Gabler David S | -- | None Available | |
| Gabler Ser M | -- | None Available | |
| Brookins Ser M | -- | None Available | |
| Brookins Ser M | -- | None Available | |
| Brookins Ser M | -- | -- | |
| Brookins June | $52,500 | Old Republic Title Ins Compa |
Source: Public Records
Mortgage History
| Date | Status | Borrower | Loan Amount |
|---|---|---|---|
| Open | Brookins June | $105,000 |
Source: Public Records
Tax History
| Year | Tax Paid | Tax Assessment Tax Assessment Total Assessment is a certain percentage of the fair market value that is determined by local assessors to be the total taxable value of land and additions on the property. | Land | Improvement |
|---|---|---|---|---|
| 2025 | $4,334 | $347,413 | $132,872 | $214,541 |
| 2023 | $4,334 | $333,924 | $127,713 | $206,211 |
| 2022 | $4,187 | $327,377 | $125,209 | $202,168 |
| 2021 | $4,189 | $320,958 | $122,754 | $198,204 |
| 2020 | $4,103 | $317,668 | $121,496 | $196,172 |
| 2019 | $4,021 | $311,440 | $119,114 | $192,326 |
| 2018 | $3,949 | $305,334 | $116,779 | $188,555 |
| 2017 | $3,919 | $299,348 | $114,490 | $184,858 |
| 2016 | $3,777 | $293,480 | $112,246 | $181,234 |
| 2015 | $3,759 | $289,072 | $110,560 | $178,512 |
| 2014 | $3,707 | $283,411 | $108,395 | $175,016 |
Source: Public Records
Map
Nearby Homes
- 200 Anita Rd
- 422 Peninsula Ave
- 869 Woodside Way
- 320 Peninsula Ave Unit 409
- 10 Channing Rd
- 30 Lorton Ave Unit 302
- 39 Victoria Rd
- 815 N Humboldt St Unit 508
- 932 Peninsula Ave Unit 406
- 821 N Humboldt St Unit 309
- 833 N Humboldt St Unit 201
- 934 Peninsula Ave Unit 301
- 835 N Humboldt St Unit 203
- 800 N Delaware St Unit 303
- 816 N Delaware St Unit 409
- 820 N Delaware St Unit 215
- 444 Villa Terrace
- 617 Woodside Way Unit C
- 33 Park Rd Unit 5
- 633 Highland Ave Unit 1
- 121 Bloomfield Rd
- 115 Bloomfield Rd
- 123 Bloomfield Rd
- 109 Bloomfield Rd
- 116 Arundel Rd
- 129 Bloomfield Rd
- 118 Arundel Rd
- 110 Arundel Rd
- 704 Bayswater Ave
- 126 Arundel Rd
- 108 Arundel Rd
- 708 Bayswater Ave
- 133 Bloomfield Rd
- 712 Bayswater Ave
- 130 Arundel Rd
- 116 Bloomfield Rd
- 114 Bloomfield Rd
- 120 Bloomfield Rd
- 716 Bayswater Ave
- 110 Bloomfield Rd
Your Personal Tour Guide
Ask me questions while you tour the home.