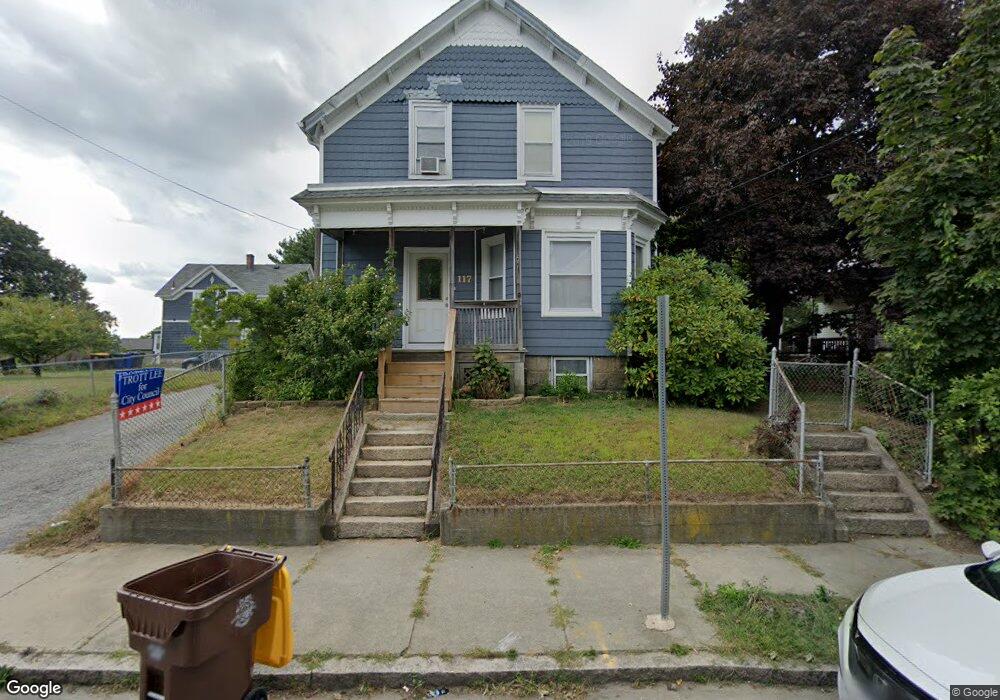
117 Bowen St Fall River, MA 02724
Sandy Beach NeighborhoodEstimated Value: $364,000 - $416,000
3
Beds
1
Bath
1,379
Sq Ft
$278/Sq Ft
Est. Value
About This Home
This home is located at 117 Bowen St, Fall River, MA 02724 and is currently estimated at $383,892, approximately $278 per square foot. 117 Bowen St is a home located in Bristol County with nearby schools including Carlton M. Viveiros Elementary School, Matthew J. Kuss Middle School, and B M C Durfee High School.
Ownership History
Date
Name
Owned For
Owner Type
Purchase Details
Closed on
Nov 26, 2003
Sold by
Bertoncini Edna A and Bertoncini Frank L
Bought by
Sousa Joao L and Vitorino Lucia F
Current Estimated Value
Home Financials for this Owner
Home Financials are based on the most recent Mortgage that was taken out on this home.
Original Mortgage
$153,000
Outstanding Balance
$71,936
Interest Rate
6.09%
Mortgage Type
Purchase Money Mortgage
Estimated Equity
$311,956
Create a Home Valuation Report for This Property
The Home Valuation Report is an in-depth analysis detailing your home's value as well as a comparison with similar homes in the area
Home Values in the Area
Average Home Value in this Area
Purchase History
| Date | Buyer | Sale Price | Title Company |
|---|---|---|---|
| Sousa Joao L | $170,000 | -- |
Source: Public Records
Mortgage History
| Date | Status | Borrower | Loan Amount |
|---|---|---|---|
| Open | Sousa Joao L | $153,000 | |
| Previous Owner | Sousa Joao L | $75,000 | |
| Previous Owner | Sousa Joao L | $30,000 | |
| Previous Owner | Sousa Joao L | $12,000 |
Source: Public Records
Tax History
| Year | Tax Paid | Tax Assessment Tax Assessment Total Assessment is a certain percentage of the fair market value that is determined by local assessors to be the total taxable value of land and additions on the property. | Land | Improvement |
|---|---|---|---|---|
| 2025 | $3,332 | $291,000 | $107,600 | $183,400 |
| 2024 | $3,140 | $273,300 | $103,700 | $169,600 |
| 2023 | $2,921 | $238,100 | $85,600 | $152,500 |
| 2022 | $2,731 | $216,400 | $81,600 | $134,800 |
| 2021 | $2,549 | $184,300 | $77,600 | $106,700 |
| 2020 | $2,581 | $178,600 | $76,500 | $102,100 |
| 2019 | $2,479 | $170,000 | $73,600 | $96,400 |
| 2018 | $2,377 | $162,600 | $79,700 | $82,900 |
| 2017 | $2,213 | $158,100 | $76,000 | $82,100 |
| 2016 | $2,162 | $158,600 | $80,900 | $77,700 |
| 2015 | $2,102 | $160,700 | $80,900 | $79,800 |
| 2014 | $1,991 | $158,300 | $78,500 | $79,800 |
Source: Public Records
Map
Nearby Homes
- 245 Dwelly St
- 464 Birch St
- 609 King Philip St
- 20 Wilcox St
- 1852 S Main St
- 1846 S Main St
- 15 Higgins St
- 57 Larouche St
- 234 Kilburn St
- 1334 S Main St
- 616 Woodman St
- 1273-1279 S Main St
- 917 Dwelly St
- 126 Wheeler St
- 24 Valley St
- 70 Brown St
- 2229 S Main St
- 344-354 E Main St
- 219 Montaup St
- 71 Mystic St Unit 3
Your Personal Tour Guide
Ask me questions while you tour the home.