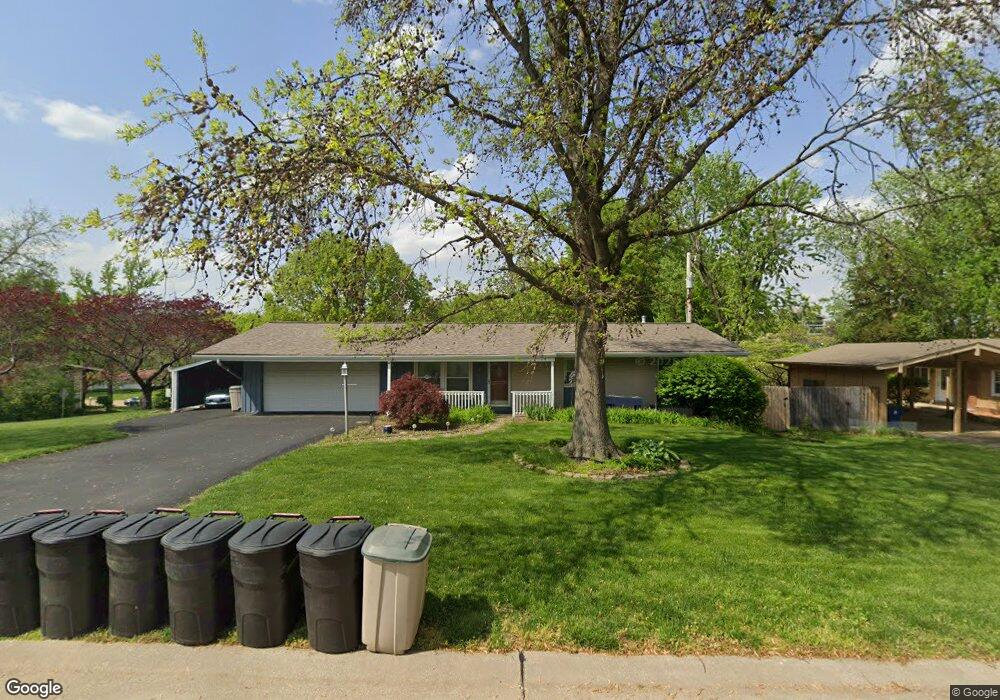
117 Brookside Ct Saint Louis, MO 63146
Estimated Value: $286,026 - $353,000
4
Beds
3
Baths
1,247
Sq Ft
$255/Sq Ft
Est. Value
About This Home
This home is located at 117 Brookside Ct, Saint Louis, MO 63146 and is currently estimated at $318,007, approximately $255 per square foot. 117 Brookside Ct is a home located in St. Louis County with nearby schools including Willow Brook Elementary School, Pattonville Heights Middle School, and Pattonville High School.
Ownership History
Date
Name
Owned For
Owner Type
Purchase Details
Closed on
Mar 8, 2006
Sold by
Lautz Jamie D and Dejesus Anna Marie
Bought by
Lautz Jamie D and Dejesus Anna Marie
Current Estimated Value
Purchase Details
Closed on
Jul 30, 2004
Sold by
Wang Chun Hsiung and Shia Chu Hwai
Bought by
Lautz Jamie D and Dejesus Anna Marie
Home Financials for this Owner
Home Financials are based on the most recent Mortgage that was taken out on this home.
Original Mortgage
$182,141
Outstanding Balance
$90,756
Interest Rate
6.18%
Mortgage Type
FHA
Estimated Equity
$227,251
Purchase Details
Closed on
Aug 13, 2002
Sold by
Goldwasser Harold A and Goldwasser Ann L
Bought by
Hsiung Chun and Shia Chu Hwai
Home Financials for this Owner
Home Financials are based on the most recent Mortgage that was taken out on this home.
Original Mortgage
$157,050
Interest Rate
6.6%
Create a Home Valuation Report for This Property
The Home Valuation Report is an in-depth analysis detailing your home's value as well as a comparison with similar homes in the area
Home Values in the Area
Average Home Value in this Area
Purchase History
| Date | Buyer | Sale Price | Title Company |
|---|---|---|---|
| Lautz Jamie D | -- | None Available | |
| Lautz Jamie D | $185,000 | -- | |
| Hsiung Chun | $174,500 | -- |
Source: Public Records
Mortgage History
| Date | Status | Borrower | Loan Amount |
|---|---|---|---|
| Open | Lautz Jamie D | $182,141 | |
| Previous Owner | Hsiung Chun | $157,050 |
Source: Public Records
Tax History
| Year | Tax Paid | Tax Assessment Tax Assessment Total Assessment is a certain percentage of the fair market value that is determined by local assessors to be the total taxable value of land and additions on the property. | Land | Improvement |
|---|---|---|---|---|
| 2025 | $3,298 | $50,160 | $13,190 | $36,970 |
| 2024 | $3,298 | $47,000 | $6,590 | $40,410 |
| 2023 | $3,311 | $47,000 | $6,590 | $40,410 |
| 2022 | $3,073 | $39,690 | $9,900 | $29,790 |
| 2021 | $3,056 | $39,690 | $9,900 | $29,790 |
| 2020 | $2,758 | $34,360 | $8,250 | $26,110 |
| 2019 | $2,741 | $34,360 | $8,250 | $26,110 |
| 2018 | $2,394 | $27,480 | $8,250 | $19,230 |
| 2017 | $2,400 | $27,480 | $8,250 | $19,230 |
| 2016 | $2,563 | $28,820 | $6,590 | $22,230 |
Source: Public Records
Map
Nearby Homes
- 118 Brookside Ct
- 141 Meadowlark Dr
- 156 Forest Brook Ln
- 10381 Oxford Hill Dr Unit 6
- 10381 Oxford Hill Dr Unit 14
- 10367 Oxford Hill Dr Unit 26
- 10387 Forest Brook Ln Unit F
- 10391 Forest Brook Ln Unit C
- 1411 Willow Brook Cove Unit 8
- 1380 Willow Brook Cove Ct Unit 1
- 10379 Forest Brook Ln Unit G
- 11152 Port Royal Dr
- 1467 Willow Brook Cove Unit C1467
- 10429 Corbeil Dr Unit 60
- 10407 Briarbend Dr Unit 3
- 10401 Briarbend Dr Unit 4
- 10328 Forest Brook Ln Unit H
- 10446 Willowdale Dr Unit 10446
- 1054 Willow Brook Dr
- 10457 Briarbend Dr Unit 8
- 116 Willow Brook Dr
- 126 Brookside Ct
- 127 Willow Brook Dr
- 81 Willow Brook Dr
- 115 Willow Brook Dr
- 119 Brookside Ct
- 82 Pebblebrook Ln
- 125 Brookside Ct
- 80 Willow Brook Dr
- 124 Brookside Ct
- 79 Willow Brook Dr
- 114 Willow Brook Dr
- 83 Pebblebrook Ln
- 143 Willow Brook Dr
- 120 Brookside Ct
- 144 Meadowlark Dr
- 106 Willow Brook Dr
- 145 Glenridge Ln
- 84 Pebblebrook Ln
- 78 Willow Brook Dr
Your Personal Tour Guide
Ask me questions while you tour the home.