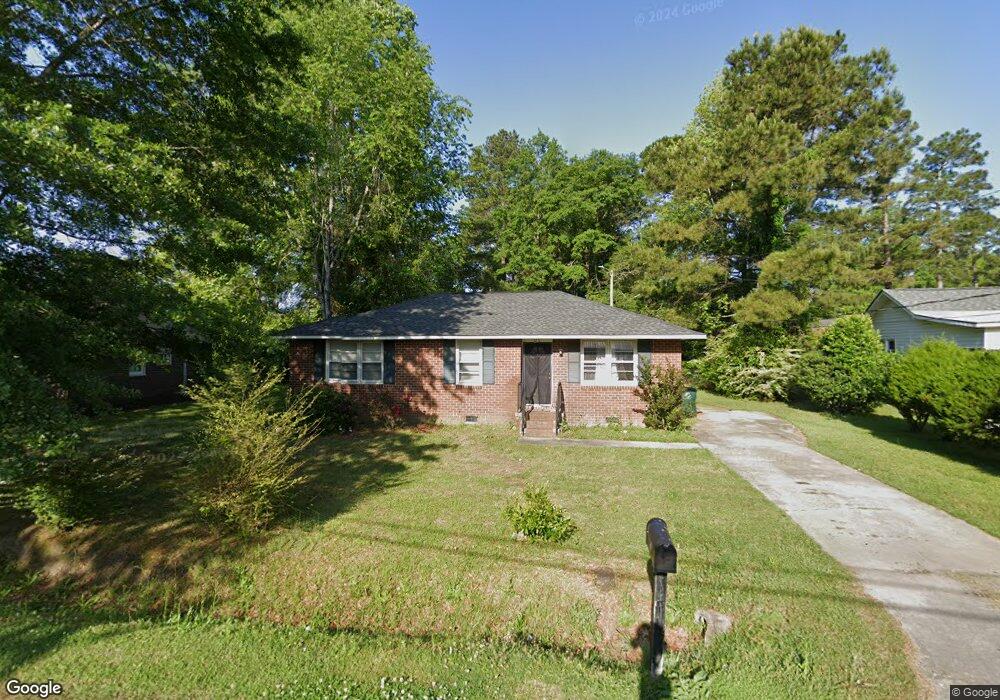
117 Calhoun St Manning, SC 29102
Estimated Value: $91,000 - $126,000
3
Beds
1
Bath
1,014
Sq Ft
$111/Sq Ft
Est. Value
About This Home
This home is located at 117 Calhoun St, Manning, SC 29102 and is currently estimated at $113,000, approximately $111 per square foot. 117 Calhoun St is a home located in Clarendon County with nearby schools including Laurence Manning Academy.
Ownership History
Date
Name
Owned For
Owner Type
Purchase Details
Closed on
Nov 3, 2009
Sold by
Estate Of George W Jordan Jr
Bought by
Jones Candace O
Current Estimated Value
Home Financials for this Owner
Home Financials are based on the most recent Mortgage that was taken out on this home.
Original Mortgage
$60,180
Interest Rate
4.92%
Mortgage Type
New Conventional
Purchase Details
Closed on
Oct 9, 2007
Sold by
Estate Of Franklin D Lemon
Bought by
Jordan George W
Create a Home Valuation Report for This Property
The Home Valuation Report is an in-depth analysis detailing your home's value as well as a comparison with similar homes in the area
Home Values in the Area
Average Home Value in this Area
Purchase History
| Date | Buyer | Sale Price | Title Company |
|---|---|---|---|
| Jones Candace O | $59,000 | None Available | |
| Jordan George W | $39,000 | None Available |
Source: Public Records
Mortgage History
| Date | Status | Borrower | Loan Amount |
|---|---|---|---|
| Previous Owner | Jones Candace O | $60,180 |
Source: Public Records
Tax History
| Year | Tax Paid | Tax Assessment Tax Assessment Total Assessment is a certain percentage of the fair market value that is determined by local assessors to be the total taxable value of land and additions on the property. | Land | Improvement |
|---|---|---|---|---|
| 2025 | $1,927 | $3,108 | $360 | $2,748 |
| 2024 | $1,676 | $3,108 | $360 | $2,748 |
| 2023 | $1,628 | $3,108 | $360 | $2,748 |
| 2022 | $1,608 | $3,108 | $360 | $2,748 |
| 2021 | $554 | $3,060 | $360 | $2,700 |
| 2020 | $554 | $1,884 | $0 | $0 |
| 2019 | $529 | $1,884 | $180 | $1,704 |
| 2018 | $516 | $1,884 | $0 | $0 |
| 2017 | $510 | $1,884 | $0 | $0 |
| 2016 | $509 | $1,884 | $0 | $0 |
| 2015 | $490 | $1,908 | $180 | $1,728 |
| 2014 | $491 | $1,908 | $180 | $1,728 |
| 2013 | -- | $1,908 | $180 | $1,728 |
Source: Public Records
Map
Nearby Homes
- 401 W Huggins St
- 387 Drayton St
- 250 Dyson St
- TBD W Huggins St
- 408 Toccoa Dr
- 1000 Carolina Way
- 200 W Boyce St
- 633 Sykes St
- TBD Barnwell St
- 107 Sumter St
- 101 Sumter St
- 5301 Cypress Pointe #D301
- 950 Berry St
- 126 Hillcrest St
- 22 W End St
- TBD Branchview Dr
- 617 Pickwood Dr
- 202 E Huggins St
- 623 Pickwood Dr
- 138 Nelson Cir
Your Personal Tour Guide
Ask me questions while you tour the home.